Overview
The article focuses on understanding the Albumin/Globulin (A/G) ratio levels and their significance for health insights, indicating that these levels are crucial for assessing liver function, kidney condition, and nutritional status. It supports this by explaining how deviations from the normal A/G range can signal various health concerns, including serious diseases, and emphasizes the importance of regular monitoring and lifestyle factors in maintaining optimal A/G levels for better overall health management.
Introduction
The Albumin/Globulin (A/G) ratio is more than just a number; it serves as a vital indicator of overall health, particularly in the context of chronic diseases such as diabetes. By comparing the levels of albumin and globulin, this crucial laboratory measurement offers insights into liver function, kidney health, and nutritional status.
With a normal A/G ratio typically ranging from 1.0 to 2.5, deviations from this range can signal potential health issues, making it an essential tool for disease monitoring and management. Recent research highlights the significance of the A/G ratio in various medical scenarios, including its role in oncology and chronic disease management.
Understanding this ratio not only aids in the early detection of health concerns but also empowers patients to engage in informed discussions with their healthcare providers, ultimately leading to more tailored and effective health strategies.
Understanding the Albumin/Globulin (A/G) Ratio: Importance and Basics
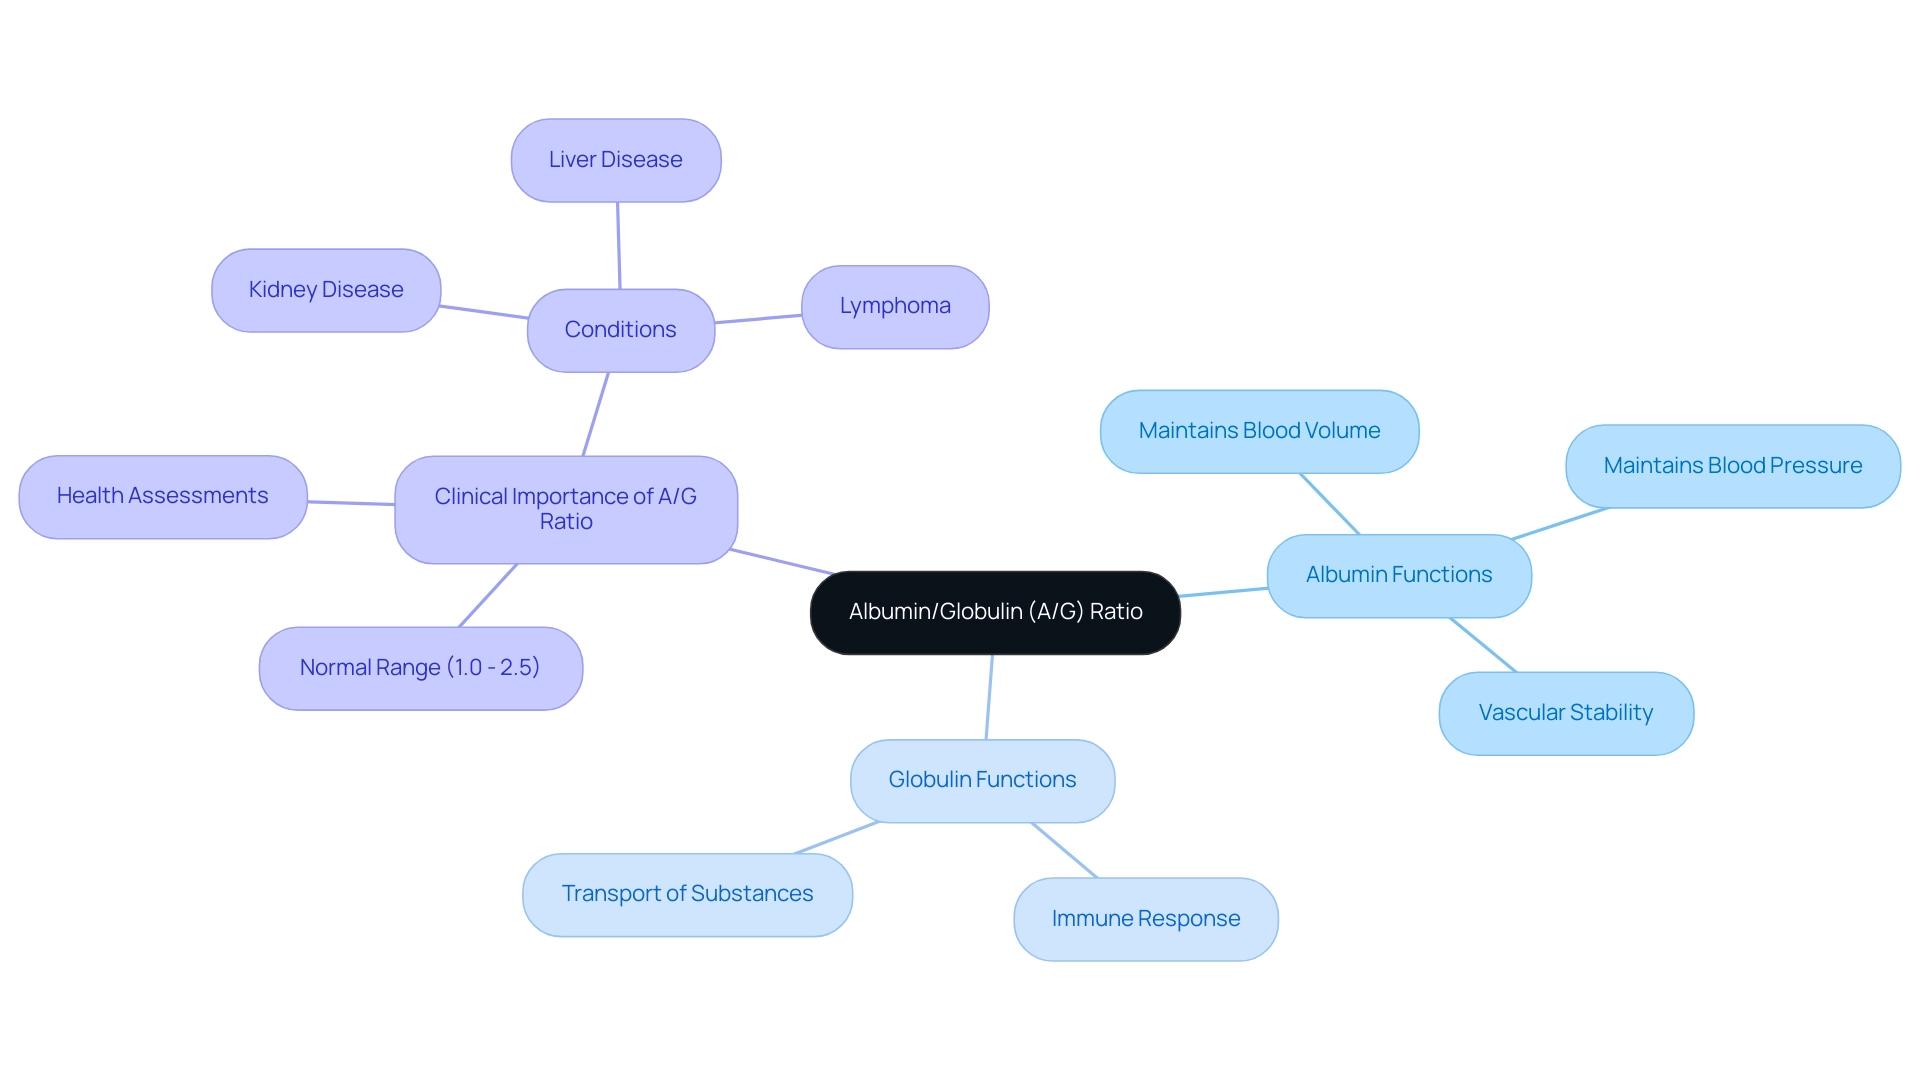
The Albumin/Globulin (A/G) comparison is a critical laboratory measurement obtained from a standard blood test, comparing the levels of two primary proteins in the blood: albumin and globulin. Albumin, synthesized by the liver, is essential for maintaining blood volume and pressure, thereby contributing to overall vascular stability. In contrast, globulins comprise a diverse group of proteins that play pivotal roles in immune response and the transport of various substances within the body.
Understanding the A/G ratio levels is essential as they provide important insights into liver function, kidney condition, and nutritional status. Typically, a normal A/G proportion falls within the range of 1.0 to 2.5. However, deviations from this range can signal underlying health concerns, making the A/G ratio levels a significant marker for health assessments and disease monitoring.
Recent studies have highlighted the significance of A/G ratio levels, especially in assessing conditions like liver and kidney diseases, where the A/G ratio levels can aid in evaluating disease severity and directing clinical choices. Notably, research indicates that the A/G measurement serves as a significant predictor in patients with diffuse large B cell lymphoma, highlighting its relevance in oncology. Additionally, doctors may order an A/G test if patients exhibit symptoms such as unexplained weight loss, fluid accumulation, jaundice, or fatigue, illustrating its practical implications in clinical settings.
Additionally, logistic regression analysis has been employed to investigate the connection between various wellness outcomes and the A/G ratio levels, boosting the reliability of its application in evaluations.
Interpreting A/G Ratio Results: What High and Low Levels Mean
A high A/G ratio levels can suggest various medical conditions, ranging from dehydration to excessive protein consumption, and may also indicate more serious illnesses such as certain cancers or chronic inflammatory disorders. Conversely, low a/g ratio levels are often associated with serious health problems such as liver disease, kidney disease, or malnutrition. For patients handling type 2 diabetes at the Integrative Wellness Center, monitoring a/g ratio levels is essential, as fluctuations may indicate changes in kidney function or the onset of complications.
Recent studies have demonstrated a noteworthy connection between high serum A/G ratio levels and enhanced functional outcomes, as well as reduced mortality risk, especially among patients with higher A/G ratio levels, who display an odds value of 0.37 for mortality compared to lower quartiles. This correlation emphasizes the significance of a/g ratio levels in comprehending overall wellness and highlights the center’s comprehensive strategy to reversing diabetes by addressing root causes. Moreover, alterations in homeostatic factors could be indicated by A/G ratio levels, resulting in innovative approaches for predictive screening, which is essential for preventive wellness measures.
Patients are encouraged to engage in discussions with their healthcare providers regarding their a/g ratio levels, as this dialogue is essential for comprehending the broader context of their well-being and developing a tailored management plan. As highlighted by Vicki Gunvalson, effective wellness monitoring is essential, especially after misdiagnoses that can change treatment approaches, thus emphasizing the necessity for precise a/g ratio levels interpretation in managing wellbeing. Numerous patients at the Integrative Wellness Center have shared their success stories, highlighting how understanding their A/G ratio levels has not only guided their wellness strategies but also alleviated their worries about potential diabetes complications, allowing them to find peace in their journey toward better well-being.
Factors Affecting A/G Ratio Levels: Lifestyle and Medical Considerations
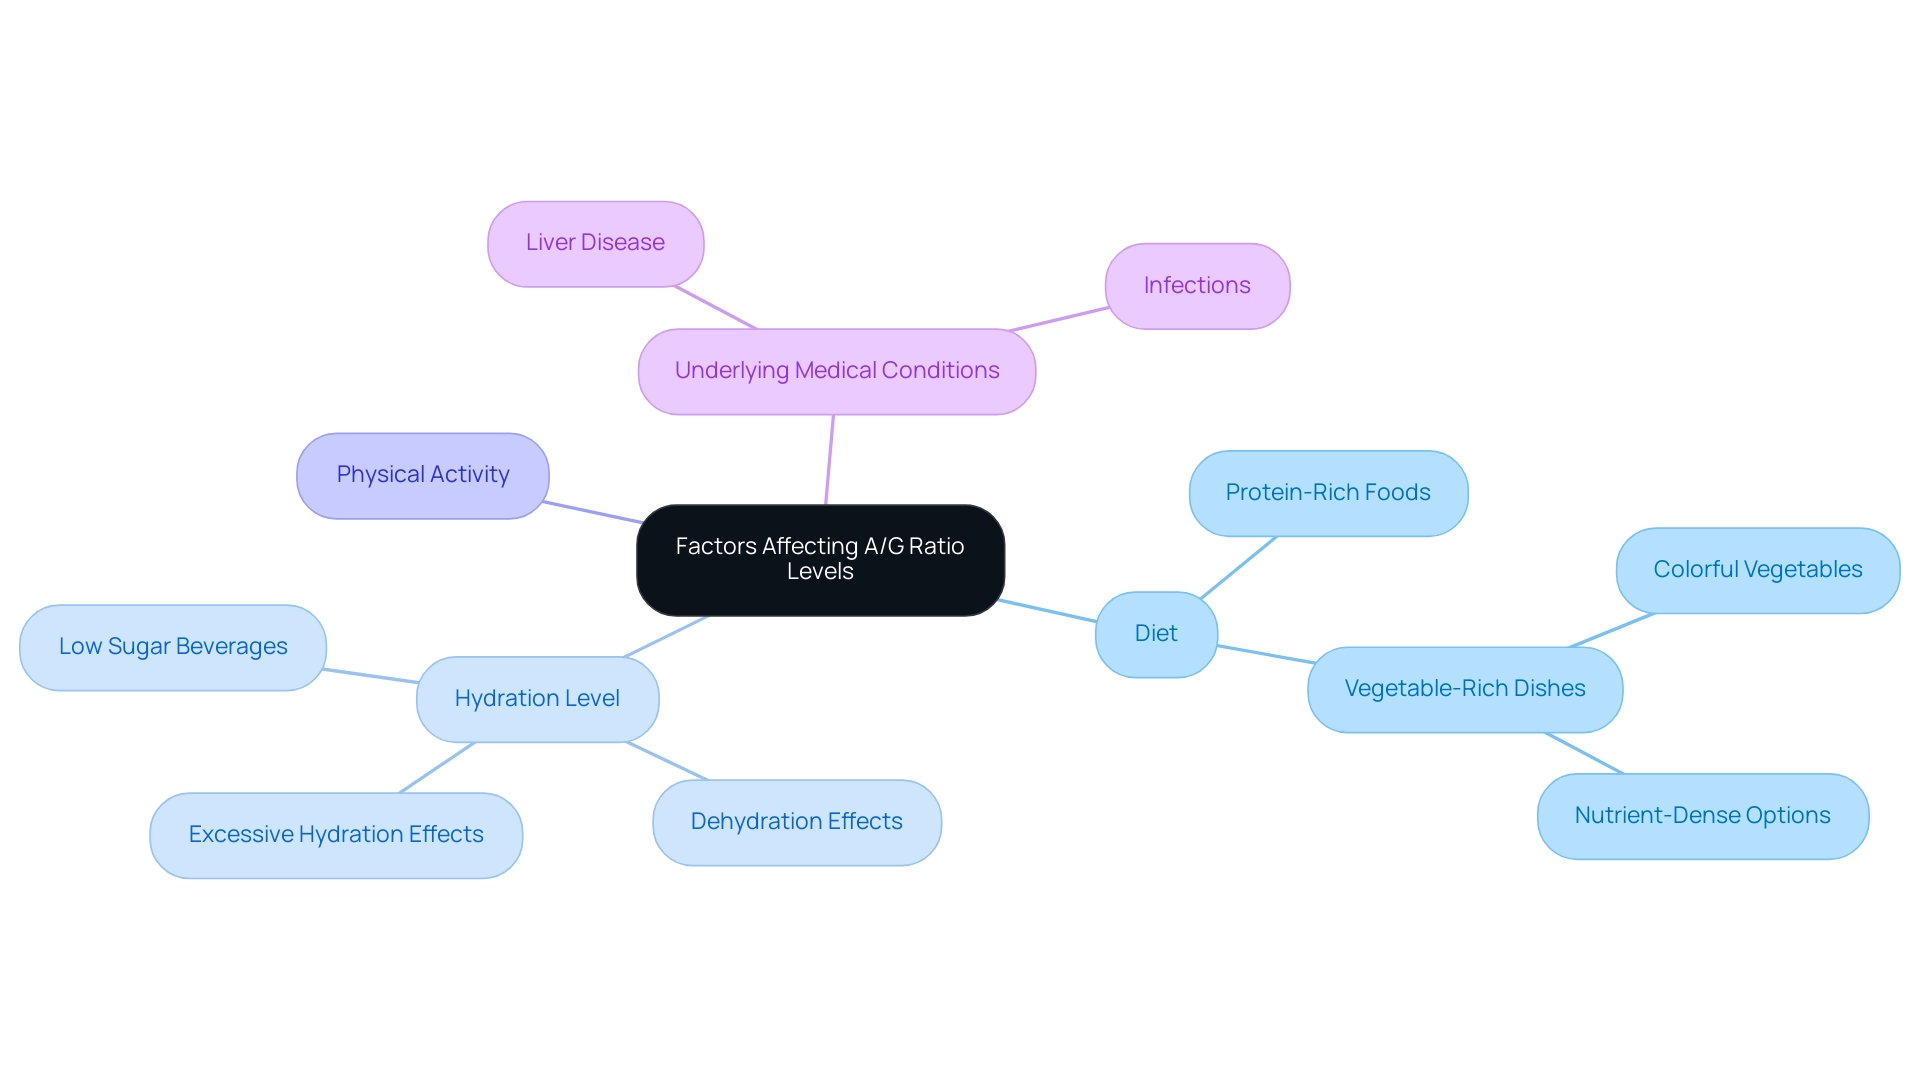
Multiple lifestyle elements greatly affect the a/g ratio levels, including:
- Diet
- Hydration level
- Physical activity
- Underlying medical conditions
A diet abundant in protein can increase albumin amounts, thereby enhancing the a/g ratio levels. Including vegetable-rich dishes in a diabetes-friendly diet, characterized by colorful and nutrient-dense vegetables, can further support blood sugar regulation and overall health.
Hydration strategies play a crucial role in diabetes management; choosing local beverage options that are low in sugar can help maintain optimal hydration without negatively affecting blood sugar. On the other hand, persistent conditions like liver disease or infections can cause reduced albumin and elevated globulin amounts, which can result in diminished a/g ratio levels. Dehydration presents another factor; it can artificially elevate the a/g ratio levels due to concentrated proteins in the blood.
Conversely, excessive hydration may dilute protein concentrations, potentially resulting in a misleadingly low a/g ratio levels. Acknowledging these factors allows individuals to make lifestyle adjustments that can positively influence their a/g ratio levels and overall well-being. Recent studies indicate that the median triglyceride (TG) concentration was found to be 1.37 mmol/L, highlighting the importance of monitoring these amounts in relation to dietary choices and wellness management.
As noted in the study, After we explained the purpose of the study, written informed consent was obtained from all participants, emphasizing the importance of ethical standards in research. Moreover, findings from the case study titled [Participant Characteristics Overview](https://pmc.ncbi.nlm.nih.gov/articles/PMC5146886) indicate that although the CD group did not exhibit significant differences in verbal fluency during the initial evaluation, their scores markedly decreased in the follow-up, highlighting the advancement of cognitive impairment and the influence of lifestyle factors on overall well-being. Ultimately, understanding how diet, especially the inclusion of vegetables, and hydration influence albumin and globulin levels is essential for maintaining a healthy balance in the a/g ratio levels.
Monitoring A/G Ratio Levels: Testing Frequency and Recommendations
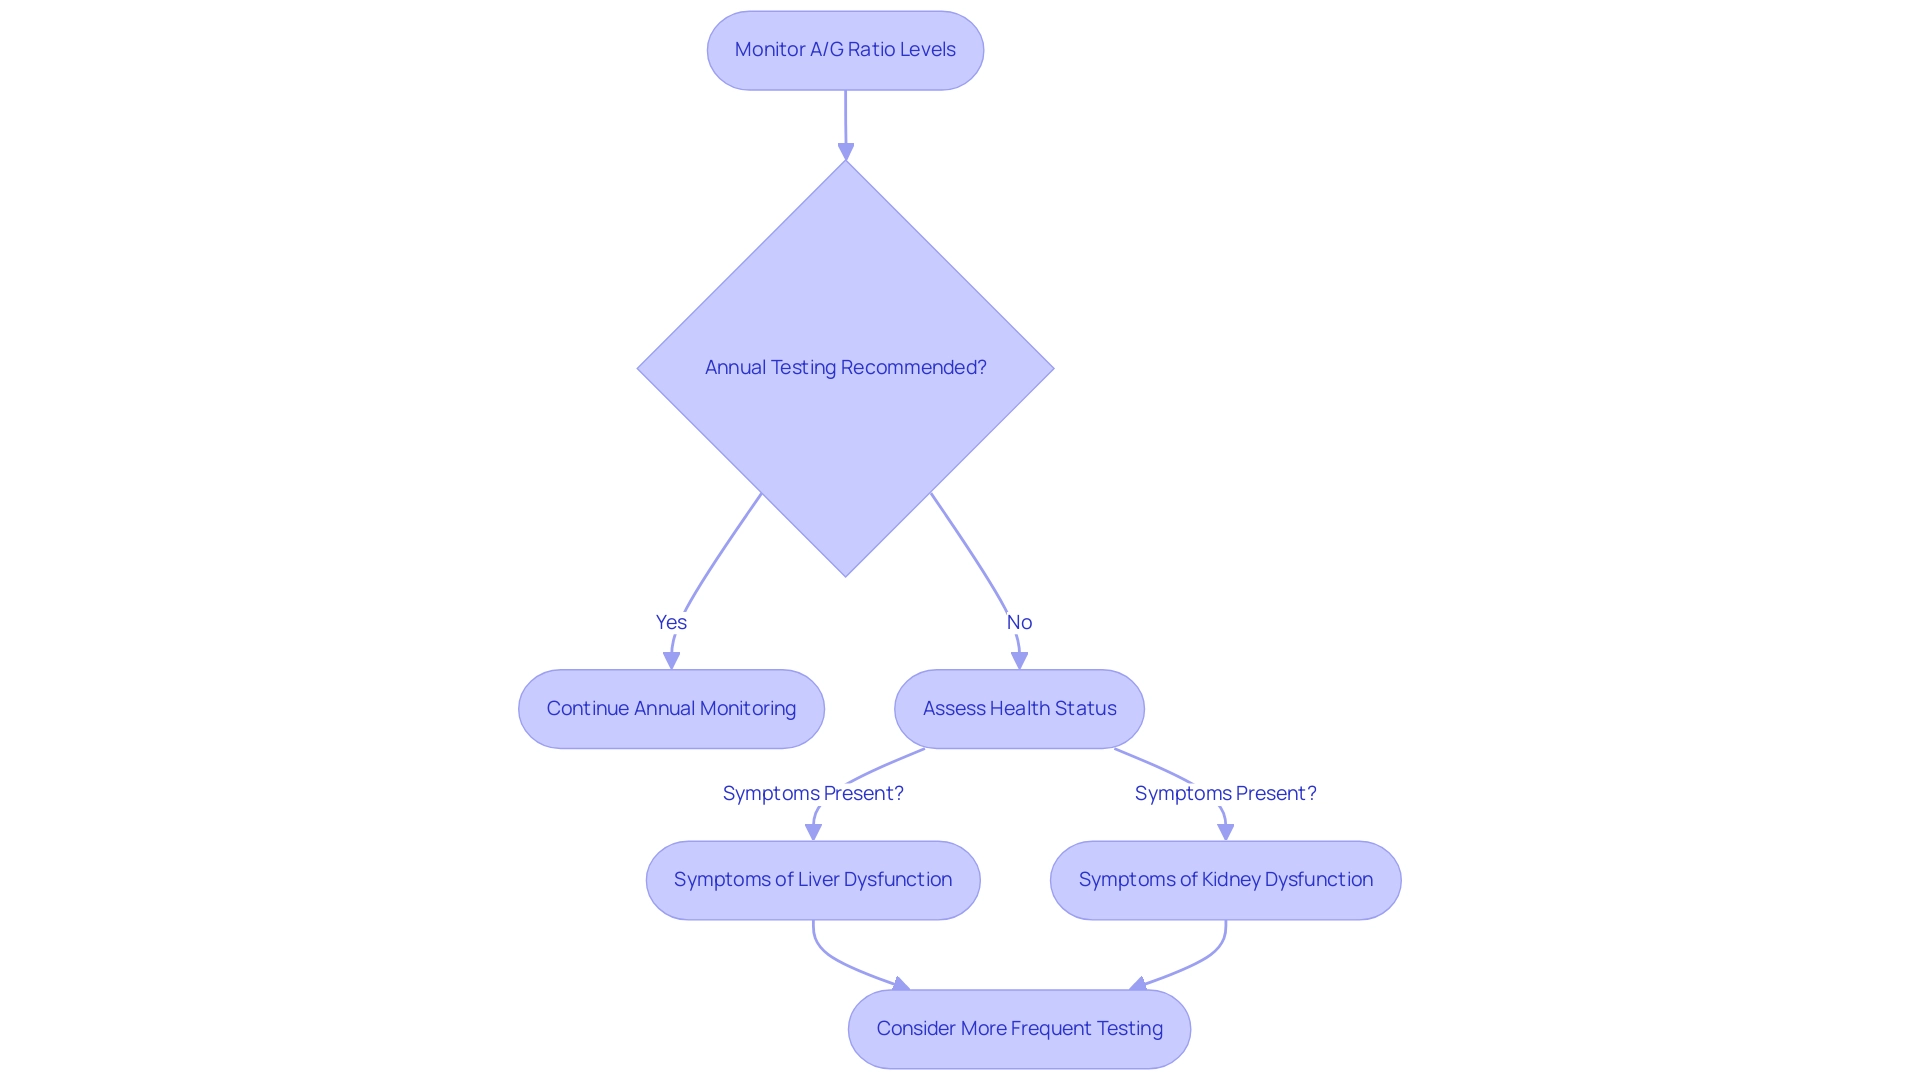
For individuals managing diabetes or those at increased risk for protein-related wellness concerns, regular monitoring of a/g ratio levels is essential to their comprehensive well-being strategy. Current guidelines typically recommend that this test be performed annually; however, the necessity for more frequent testing may arise based on specific health conditions or notable changes in a patient’s status. The typical range of albumin is 35 to 52 g/L, which offers a standard for evaluating a/g ratio levels.
Engaging in discussions with healthcare providers is essential for patients to establish the most appropriate testing frequency, particularly if they present symptoms indicative of liver or kidney dysfunction. Monitoring a/g ratio levels over time is essential, as it can uncover trends that may necessitate further investigation or medical intervention. Significantly, abnormal a/g ratio levels can indicate a variety of medical issues, including cancers, autoimmune diseases, or genetic disorders.
For example, a research titled ‘Preoperative Inversed Albumin-to-Globulin Proportion and Oncologic Prognosis’ discovered that an inverse proportion predicts poorer oncologic outcomes after surgery, emphasizing the significance of proactive wellness management, especially in relation to diabetes. By re-examining the source of diabetes, patients can better understand their condition and how to manage it effectively, which can significantly reduce anxiety about potential complications. As Sarah Daglis, ND, emphasizes, ‘Understanding the nuances of A/G ratio levels can significantly enhance diabetes management and overall health outcomes,’ empowering patients to eliminate anxiety surrounding potential complications through informed, holistic care at the Integrative Wellness Center.
A/G Ratio and Chronic Diseases: Implications for Health Management
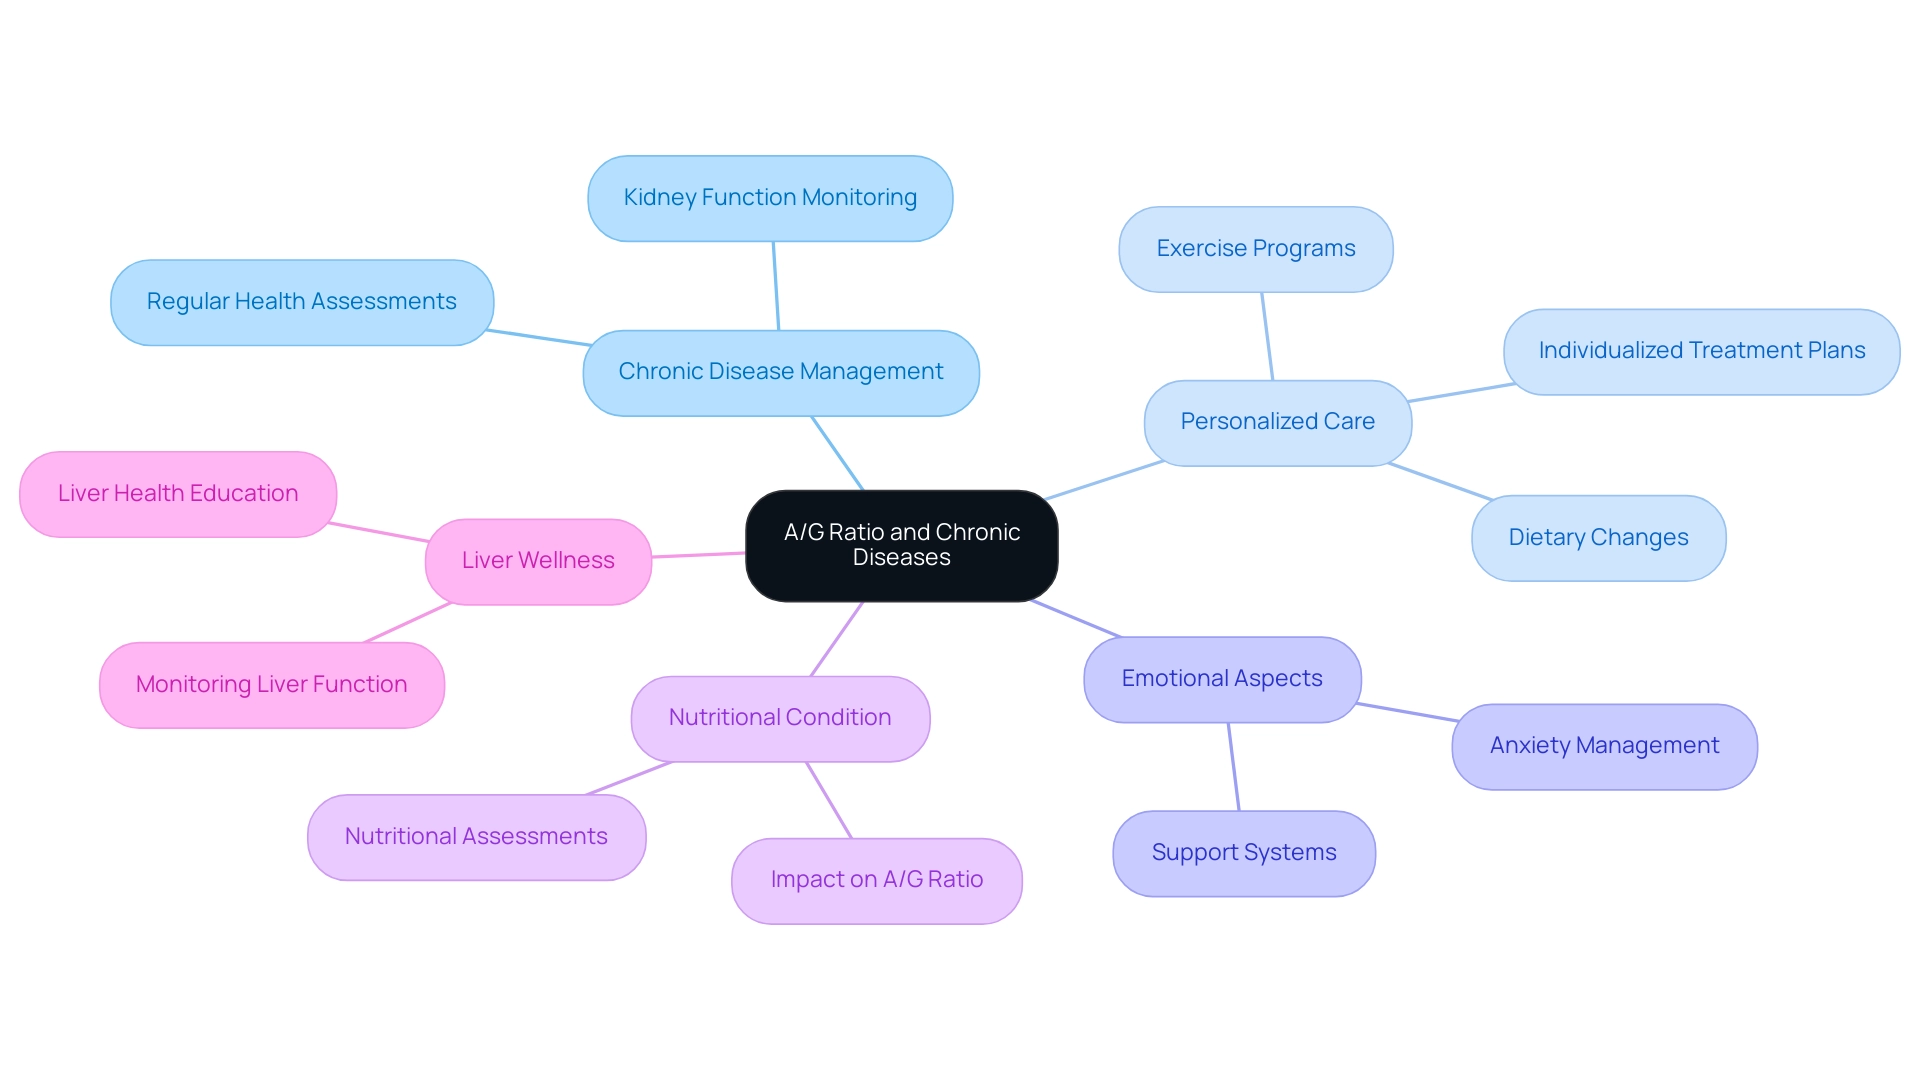
The A/G metric serves as a crucial biomarker in the management of chronic diseases, particularly in diabetes. A consistent low A/G level may indicate declining kidney function in diabetic patients, necessitating closer monitoring and adjustments to treatment strategies. As one patient shared,
‘Being a diabetic for 10 years, my regular doctor kept adding med after med.
When I started this program, the doctor gave great personal attention and care in helping fix my condition. I have lost 55 lbs, and my A1C started at 9.1; after 8 months, it is now 5.7.’
This transformative success story exemplifies the effectiveness of addressing the root causes of diabetes through personalized care at the Integrative Wellness Center.
These cases underscore the importance of a holistic approach to well-being, which includes not only dietary changes and exercise but also addressing the emotional aspects of managing diabetes, such as anxiety about potential complications. Research indicates that variations in the A/G ratio levels can reflect changes in nutritional condition or liver wellness, both crucial for effective disease management. Understanding the implications of A/G ratio levels enables patients and healthcare providers to collaborate effectively, customizing treatment plans that enhance overall health outcomes and potentially reversing chronic conditions.
Conclusion
The Albumin/Globulin (A/G) ratio is a vital marker for assessing overall health, particularly in the context of chronic diseases like diabetes. By examining the levels of albumin and globulin in the blood, healthcare providers can gain crucial insights into liver function, kidney health, and nutritional status. Understanding the normal range of the A/G ratio, typically between 1.0 and 2.5, is essential, as deviations can indicate serious health concerns that require attention.
Monitoring the A/G ratio is particularly important for individuals managing diabetes, as fluctuations can signal changes in kidney function or the onset of complications. By engaging in discussions with healthcare providers regarding A/G ratio results, patients can develop tailored management strategies that address their specific health needs. Lifestyle factors, including diet and hydration, also play a significant role in influencing the A/G ratio, highlighting the importance of a holistic approach to health management.
In conclusion, the A/G ratio serves as a crucial biomarker in managing chronic diseases, providing valuable information for both patients and healthcare professionals. Regular monitoring and interpretation of this ratio can lead to improved health outcomes, allowing individuals to take proactive steps in their health journey. Understanding the implications of the A/G ratio empowers patients to make informed decisions, ultimately fostering better health management and enhancing overall quality of life.
Frequently Asked Questions
What is the A/G ratio and why is it important?
The A/G ratio compares the levels of two primary proteins in the blood: albumin and globulin. It provides insights into liver function, kidney condition, and nutritional status, making it significant for health assessments and disease monitoring.
What are the normal A/G ratio levels?
A normal A/G ratio typically falls within the range of 1.0 to 2.5.
What can deviations from the normal A/G ratio indicate?
Deviations from the normal A/G ratio can signal underlying health concerns, such as liver or kidney diseases, and may require further investigation.
How is the A/G ratio used in clinical settings?
Doctors may order an A/G test if patients exhibit symptoms like unexplained weight loss, fluid accumulation, jaundice, or fatigue, as it helps evaluate disease severity and direct clinical choices.
What health conditions are associated with high A/G ratio levels?
High A/G ratio levels can suggest conditions like dehydration, excessive protein consumption, certain cancers, or chronic inflammatory disorders.
What health issues are linked to low A/G ratio levels?
Low A/G ratio levels are often associated with serious health problems such as liver disease, kidney disease, or malnutrition.
Why is monitoring A/G ratio levels important for patients with type 2 diabetes?
For patients with type 2 diabetes, monitoring A/G ratio levels is essential as fluctuations may indicate changes in kidney function or the onset of complications.
What recent findings have been made regarding high A/G ratio levels?
Recent studies have shown a connection between high serum A/G ratio levels and enhanced functional outcomes, as well as reduced mortality risk among patients.
How can A/G ratio levels impact wellness strategies?
Understanding A/G ratio levels can guide wellness strategies and alleviate worries about potential diabetes complications, allowing patients to find peace in their health journey.
What should patients do regarding their A/G ratio levels?
Patients are encouraged to discuss their A/G ratio levels with their healthcare providers to understand the broader context of their well-being and develop a tailored management plan.
