Overview
The article focuses on how the A1C test and its corresponding average blood sugar chart are essential tools for diabetes management, providing insights into long-term glucose control and personalized care strategies. It emphasizes the importance of understanding A1C results in conjunction with lifestyle modifications, regular monitoring, and community support, all of which contribute significantly to improved health outcomes for diabetes patients.
Introduction
The A1C test stands as a cornerstone in diabetes management, offering critical insights into average blood glucose levels over the preceding months. This essential diagnostic tool not only aids in the diagnosis of diabetes but also plays a pivotal role in ongoing monitoring, providing a broader perspective on blood sugar control than daily checks can deliver.
With results expressed as a percentage, understanding these figures is crucial for effective diabetes management and decision-making. Moreover, the impact of lifestyle modifications—such as diet and exercise—on A1C levels cannot be overstated, as they can lead to significant improvements in health outcomes.
This article explores the A1C test’s significance, the factors influencing its accuracy, and the strategies for achieving optimal A1C levels, all of which are vital for individuals navigating the complexities of diabetes care.
What is the A1C Test and Why is it Important?
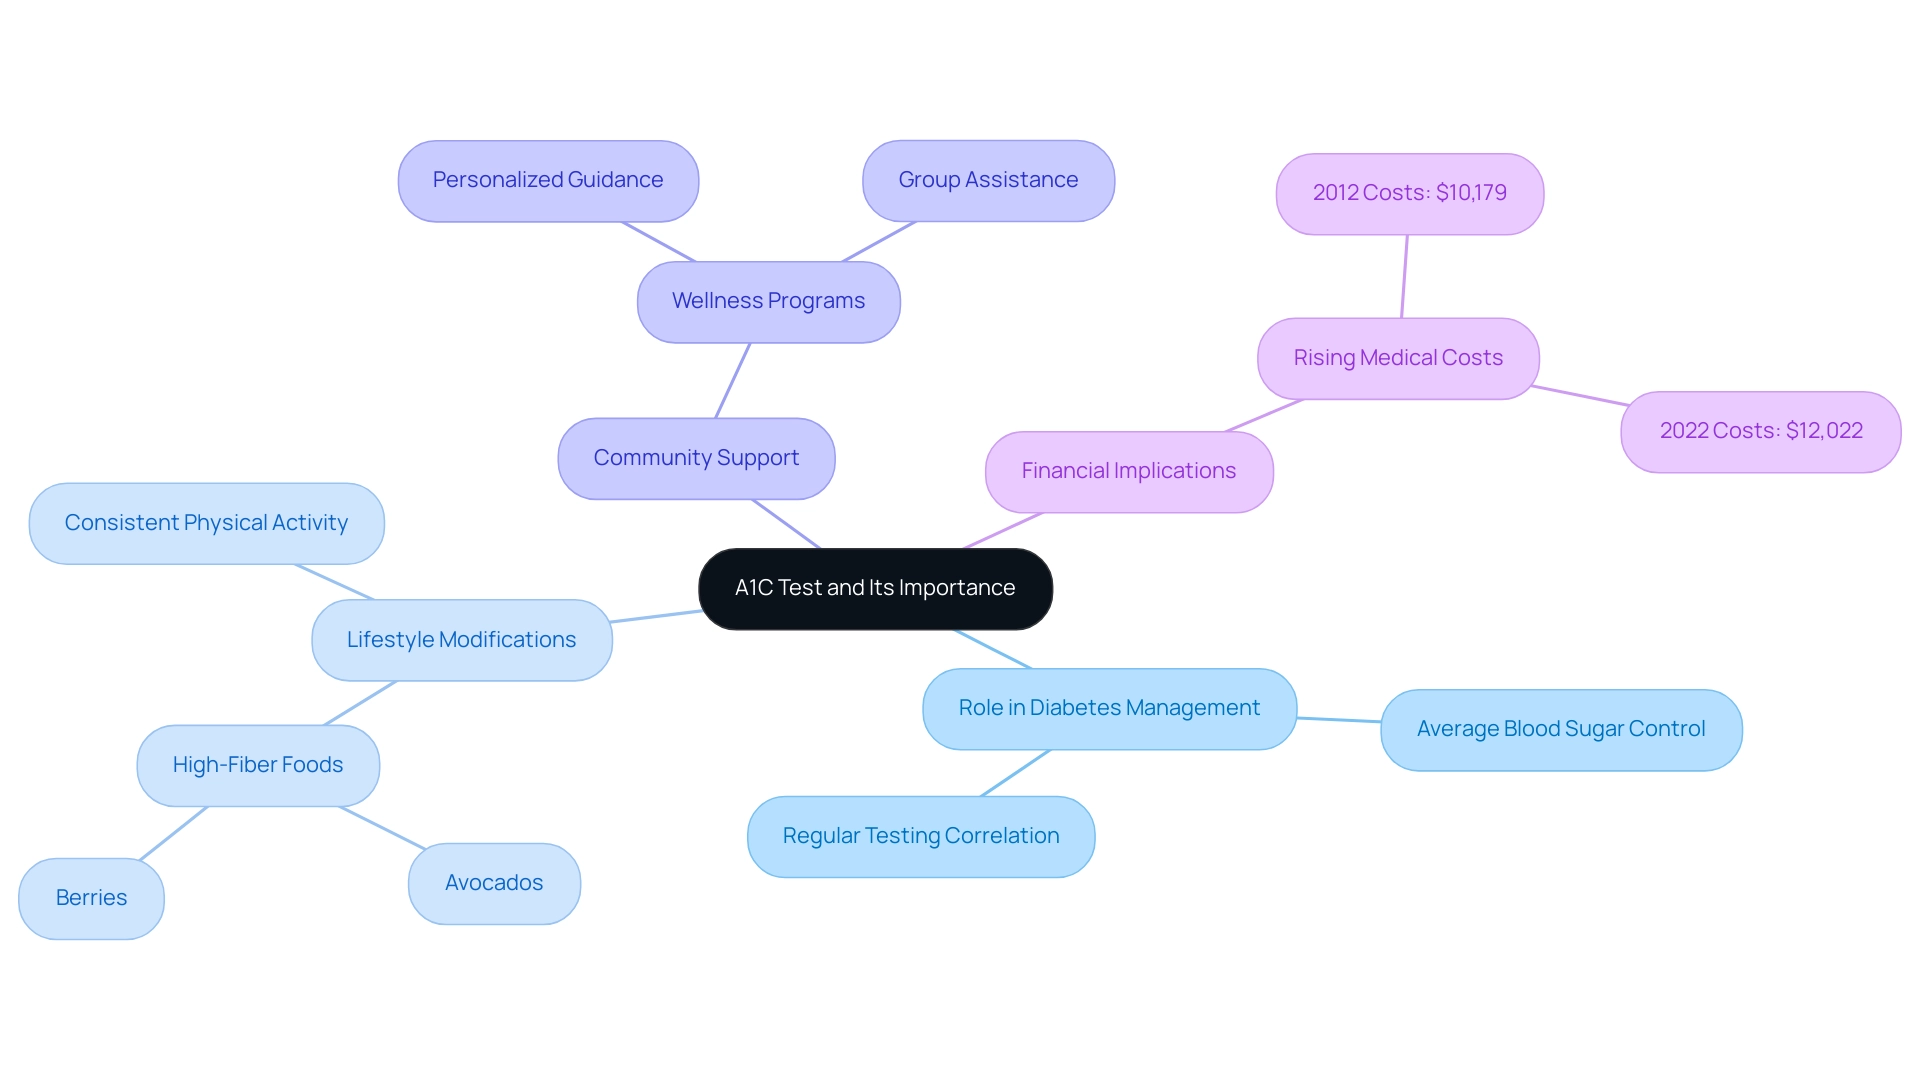
The A1C test is a crucial instrument in the control of blood sugar, as it provides an A1C to average blood sugar chart that assesses glucose levels over the prior two to three months. This test is pivotal for both diagnosing and monitoring the condition, as it provides a comprehensive view of blood sugar control beyond what daily checks can offer. A1C results are presented as a percentage; elevated percentages suggest insufficient blood sugar control, which can result in serious complications over time.
Understanding these results is vital for making informed decisions regarding diabetes management strategies, particularly when using the A1C to average blood sugar chart. Furthermore, lifestyle modifications, such as including a balanced diet abundant in local produce and participating in consistent physical activity, can significantly influence A1C values. For instance, consuming high-fiber foods like avocados and berries can help regulate blood sugar levels.
Furthermore, recent statistical analyses have shown a direct correlation between regular A1C testing and improved health outcomes, underscoring its critical role in managing blood sugar conditions as reflected in the A1C to average blood sugar chart. As emphasized in the case study titled ‘Rising Medical Costs Associated with Diabetes,’ the financial implications are considerable; between 2012 and 2022, excess medical expenses linked to the condition rose from $10,179 to $12,022 per individual, highlighting the growing burden on patients and the healthcare system. In this context, the A1C test acts not only as a measure of glycemic control but also as a vital element in an interprofessional healthcare team, particularly in relation to the A1C to average blood sugar chart, facilitating effective management of the condition.
Participating in community wellness programs in San Marcos can further assist individuals in managing their condition effectively. These programs frequently offer personalized guidance, group assistance, and resources that enhance regular A1C testing, including the use of an A1C to average blood sugar chart as part of a comprehensive care strategy. As noted, ‘Hemoglobin A1C is a valuable tool in managing blood sugar disorders and other glycemic control issues, but it functions best in an interprofessional healthcare team environment to be effective.’
This emphasizes the necessity of regular A1C testing as part of a holistic approach to diabetes care.
Decoding A1C: Understanding Its Relationship with Average Blood Sugar
The A1C test result can be effectively translated into an estimated average glucose (eAG) value using the following formula:
eAG (mg/dL) = [[(A1C × 28.7)](https://drshumard.com](https://drshumard.com/how-to-convert-a-1-c-to-mg-dl-a-step-by-step-guide/)/how-to-use-an-a-1-c-estimator-a-step-by-step-guide-for-accurate-results/) - 46.7
For example, an A1C of 7% equates to an average blood sugar level of approximately 154 mg/dL. This conversion is essential as it assists patients in connecting their laboratory results to the A1C to average blood sugar chart, thereby fostering a more comprehensive understanding of their glucose control.
According to the American Academy of Family Physicians, individuals with type 2 diabetes are advised to maintain an A1C of less than 7-8%. This goal highlights the significance of tracking A1C values and relating them to the A1C to average blood sugar chart for effective control of the condition. Furthermore, the American Diabetes Association emphasizes that while eAG can aid in understanding A1C percentages, it should not dictate treatment decisions, ensuring that patient care remains individualized and informed.
Notably, the average difference in HbA1c values between point-of-care (POC) tests and laboratory tests is −0.5%, highlighting the importance of understanding testing accuracy. To enhance control of blood sugar levels, strategies such as frequent blood glucose testing, carbohydrate counting, and stress reduction are essential. Utilizing tracking methods like fitness apps, journals, and pedometers can provide practical tools for monitoring progress.
Regularly reviewing one’s progress not only fosters accountability but also allows for the adaptation of goals in response to changing fitness levels. Engaging with community wellness programs and embracing local nutrition options in San Marcos can significantly enhance these strategies. As illustrated in the case study titled ‘Improving A1C Levels,’ D.M.N., a principal investigator, emphasizes that
'effective management of the A1C to [average blood sugar chart](https://drshumard.com/blog/understanding-the-a-1-c-chart-to-blood-glucose-an-in-depth-tutorial-for-patients) is key to achieving better health outcomes for patients with diabetes-related conditions.'
By incorporating tailored lifestyle changes and consistent progress tracking, patients can navigate their health journey more effectively.
A1C Goals: What Should Your Target Be?
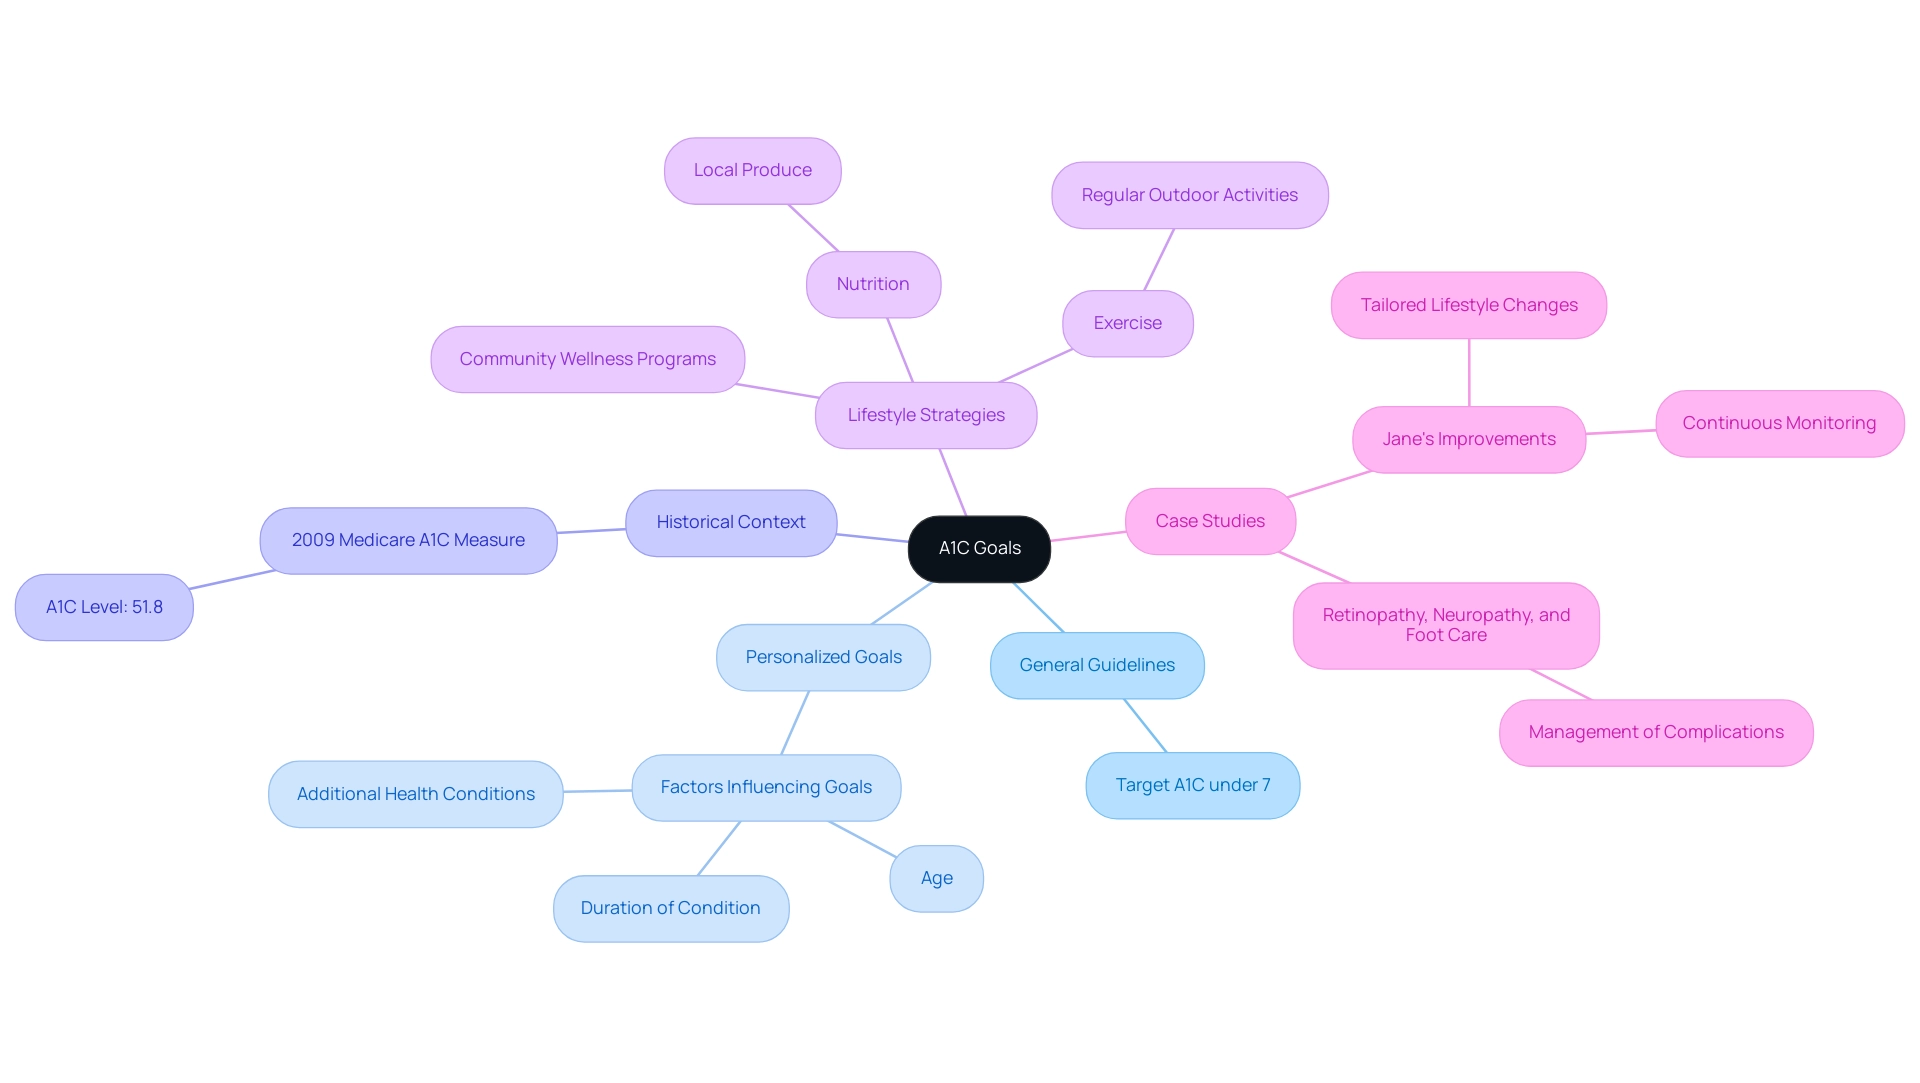
The American Diabetes Association (ADA) establishes a general guideline for adults with the condition to keep an A1C measurement under 7%, which is reflected in the a1c to average blood sugar chart. However, it is crucial to recognize that personalized A1C goals may differ based on various individual health factors, which is illustrated in the a1c to average blood sugar chart, a principle that underscores transformative management of the condition. As stated by the National Center for Chronic Disease Prevention and Health Promotion, elevated A1C readings are associated with health issues, making it essential to achieve and sustain your target using the A1C to average blood sugar chart for a healthy life with blood sugar conditions.
In 2009, the A1C measure for Medicare PPO was 51.8, illustrating the historical context of A1C levels and their relevance to current recommendations. Therefore, engaging in discussions with healthcare providers to establish the most suitable target on the a1c to average blood sugar chart is essential, taking into account elements such as age, duration of the condition, and the presence of additional health conditions. As highlighted in Recommendation 5.51, practicing sleep-promoting routines and habits can significantly impact diabetes management.
Moreover, a case study titled ‘Retinopathy, Neuropathy, and Foot Care’ emphasizes the complications associated with elevated A1C values, underscoring the importance of the a1c to average blood sugar chart in managing these risks through personalized care. Patients like Jane, who adopted a breakthrough process focusing on tailored lifestyle changes and continuous monitoring, reported significant improvements in their A1C levels and overall well-being. As we approach 2024, the latest guidelines will emphasize personalized A1C targets, and these will be detailed in the upcoming issue of Diabetes Care along with an a1c to average blood sugar chart.
These developments emphasize the necessity for a customized strategy to handle the condition, ensuring that each patient’s distinct circumstances are considered according to the a1c to average blood sugar chart. In San Marcos, CA, adopting holistic lifestyle strategies—such as emphasizing nutrition with local produce, engaging in regular outdoor exercise, and participating in community wellness programs—can further improve your journey in addressing health concerns.
Factors Affecting A1C Accuracy: What You Need to Know
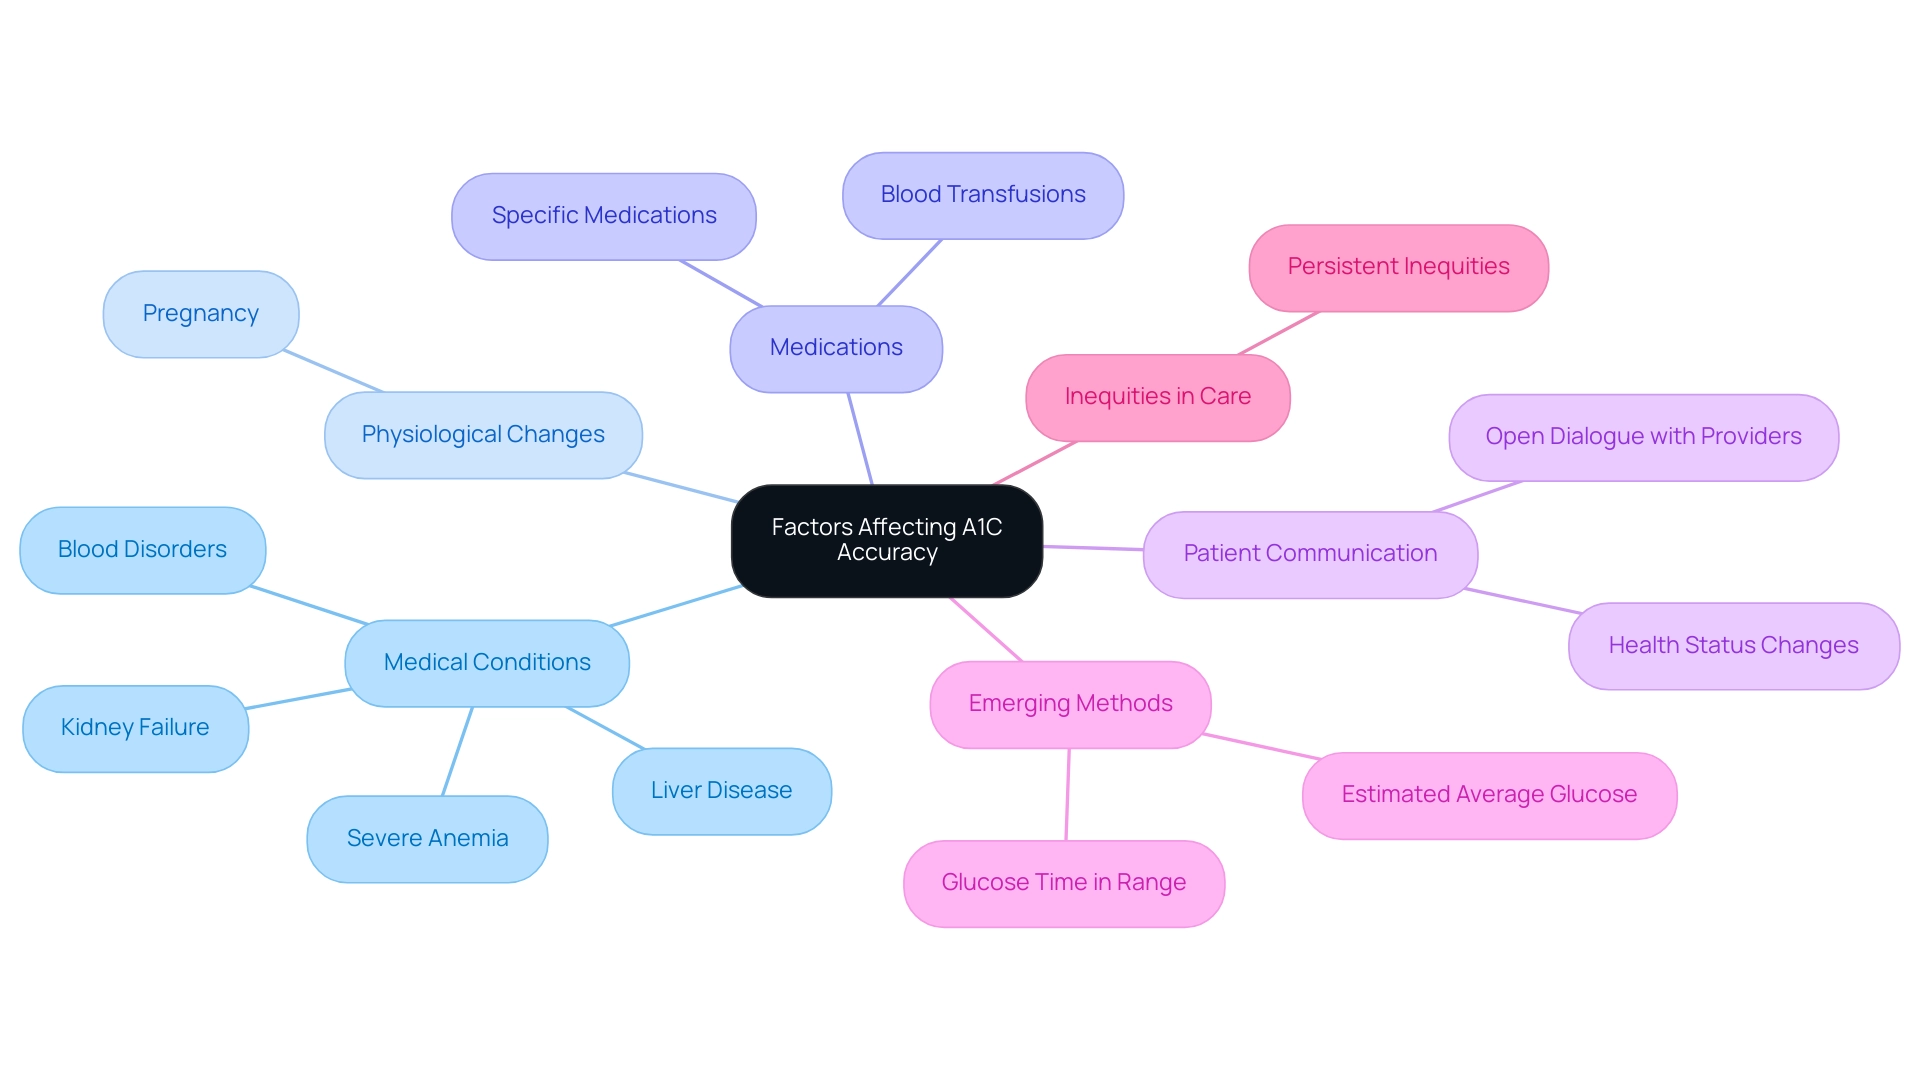
The accuracy of A1C results can be significantly influenced by various factors, such as the presence of hemoglobin variants, specific medical conditions, and physiological changes during pregnancy. Conditions like severe anemia, kidney failure, liver disease, and certain blood disorders can lead to misleading A1C readings. Additionally, medications and recent blood transfusions may distort results.
Therefore, it is crucial for patients to proactively communicate any changes in their health status or treatments to their healthcare providers. This open dialogue ensures that A1C results are interpreted correctly, facilitating more effective management of the condition through both functional and conventional medicine approaches.
Recent studies underscore persistent inequities in care, as noted by Halis K. Akturk, who stated, ‘In summary, our results suggest that inequities in care still exist.’ This emphasizes the importance of being mindful of such factors when referencing the a1c to average blood sugar chart. Furthermore, the DCCT trial reported that tighter glucose control, indicated by HbA1c levels in the 7% range or lower, was correlated with a 35 to 76% decrease in microvascular complications in patients with type 1, emphasizing the importance of accurate A1C readings.
Additionally, recognizing the prevalence of hemoglobin variants among individuals with glucose regulation issues is crucial for understanding A1C accuracy. As we shift towards emerging methods for glycemic control, such as estimated average glucose, acknowledging these limitations in A1C testing provides a broader context for effective management of the condition. Comprehensive assessments and diagnostic tests are integral to creating personalized treatment plans that consider individual lifestyle choices and genetic factors.
Furthermore, controlling blood sugar values during pregnancy is essential to avert gestational complications, highlighting the necessity for customized approaches in managing blood sugar issues, such as utilizing an a1c to average blood sugar chart. By understanding these factors, patients can take informed steps to manage their diabetes effectively, ultimately empowering themselves through holistic care at Dr. Jason Shumard’s Center.
Improving Your A1C: Lifestyle Changes and Management Strategies
To enhance your A1C measurements, consider implementing the following strategies:
-
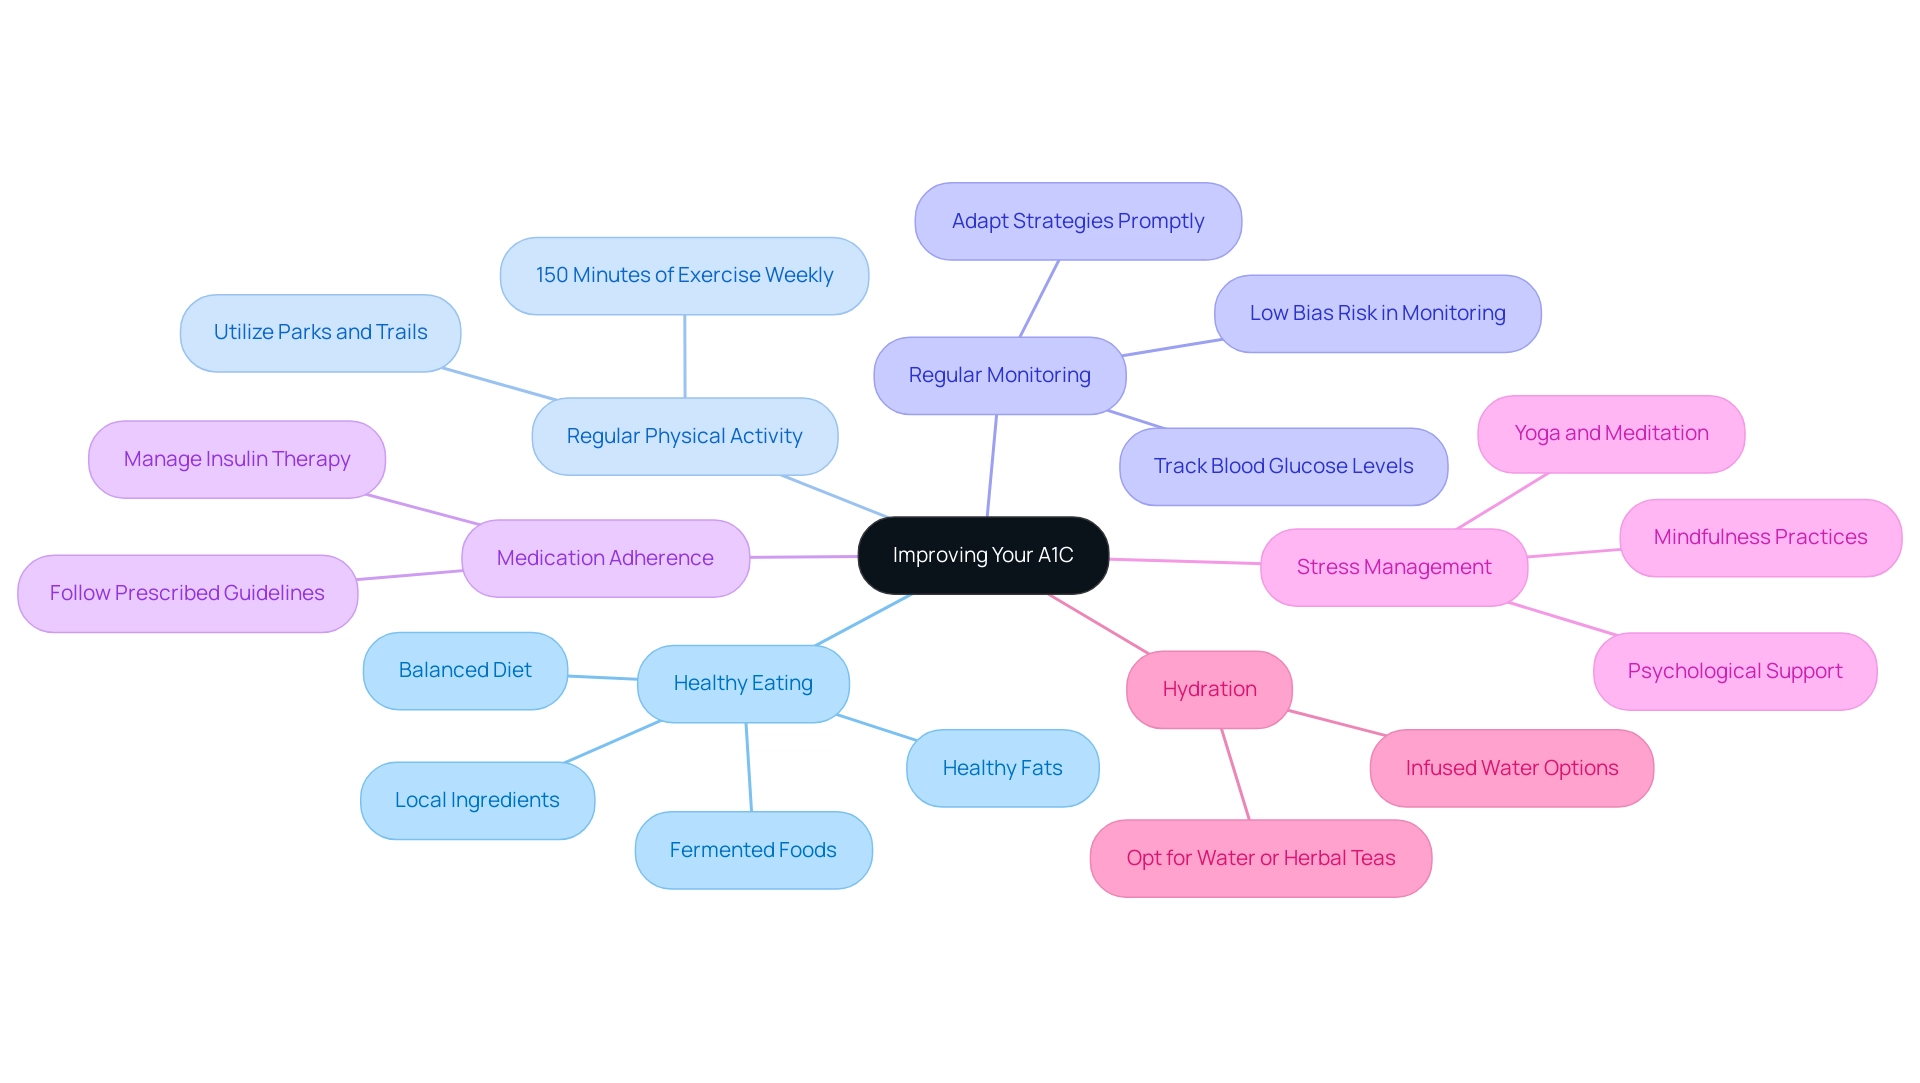
Healthy Eating: Prioritize a balanced diet that includes fresh, local ingredients, whole grains, lean proteins, fruits, and vegetables from San Marcos’ vibrant farmers’ markets, and monitor your progress with an a1c to average blood sugar chart. These foods are rich in essential nutrients, helping to minimize the intake of processed foods and added sugars. Nutritionists emphasize that a well-structured diet can significantly impact blood glucose control and overall health.
Additionally, incorporating lesser-known power-plays such as fermented foods and healthy fats can further support your dietary goals.
-
Regular Physical Activity: Strive for at least 150 minutes of moderate exercise weekly. Embrace the outdoor lifestyle available in San Marcos by utilizing scenic parks and trails for activities like hiking or walking.
Consistent physical activity is known to improve insulin sensitivity, contributing to better blood sugar regulation.
-
Regular Monitoring: Maintain a routine of tracking your blood glucose levels diligently. Regular monitoring enables prompt modifications to your oversight strategy, ensuring optimal regulation of blood sugar.
As highlighted in recent studies, 32% of research indicates low bias risk in findings related to effective monitoring. This statistic highlights the reliability of monitoring practices in blood sugar regulation. As stated in a relevant case study, addressing psychological aspects and behavior change is crucial for achieving health goals in diabetes care, fostering a supportive environment for individuals.
-
Medication Adherence: It is crucial to adhere to the medication guidelines provided by your healthcare professional. Proper management of prescribed medications and insulin therapy is essential for maintaining target A1C values as indicated by the a1c to average blood sugar chart.
-
Stress Management: Incorporate stress-reduction practices such as mindfulness, yoga, or meditation into your daily routine.
San Marcos offers numerous opportunities to practice these techniques, which can help reduce stress and improve overall mental well-being. Elevated stress levels can adversely affect blood sugar levels; hence, managing stress is crucial. Furthermore, research has indicated that addressing psychological aspects plays a significant role in achieving health goals in managing blood sugar conditions, promoting improved outcomes through a supportive environment.
-
Hydration: Staying hydrated is essential for managing blood sugar levels. Opt for water or herbal teas instead of sugary drinks to help maintain proper hydration without impacting blood sugar levels. Additionally, explore local options like infused water or natural, no-sugar-added beverages.
Incorporating these lifestyle changes can profoundly impact managing Type 2 conditions, leading to better health outcomes and improved quality of life. Remember, gradual and consistent changes are key to long-term success. For personalized guidance and support tailored to your unique needs, consider reaching out to Dr. Shumard in San Marcos, CA.
Our expert team is dedicated to helping you navigate your diabetes management journey with care and expertise.
Conclusion
The A1C test is an indispensable tool in diabetes management, offering a clear view of average blood glucose levels over time. Understanding its significance is crucial, as it not only aids in diagnosing diabetes but also plays a vital role in effective monitoring and treatment decision-making. The relationship between A1C levels and average blood sugar underscores the importance of maintaining personalized goals, which can vary based on individual health conditions and lifestyle factors.
Achieving optimal A1C levels necessitates a multifaceted approach that includes:
- Healthy eating
- Regular physical activity
- Consistent monitoring
Lifestyle modifications, such as incorporating local produce and engaging in community wellness programs, can lead to significant improvements in blood sugar control. Moreover, recognizing the factors that can affect A1C accuracy, including medical conditions and treatment changes, is essential for informed diabetes management.
In summary, the A1C test serves as a cornerstone for individuals navigating diabetes care. By fostering an understanding of A1C levels and embracing tailored strategies, patients can enhance their health outcomes and quality of life. As diabetes management continues to evolve, prioritizing regular testing and personalized care remains fundamental to achieving lasting success in blood sugar control.
Frequently Asked Questions
What is the A1C test and why is it important?
The A1C test measures average blood sugar levels over the past two to three months, providing crucial information for diagnosing and monitoring diabetes. It offers a comprehensive view of blood sugar control beyond daily checks.
How are A1C results presented and what do they indicate?
A1C results are presented as a percentage. Elevated percentages suggest insufficient blood sugar control, which can lead to serious complications over time.
How can lifestyle modifications impact A1C values?
Lifestyle changes, such as maintaining a balanced diet rich in local produce and engaging in regular physical activity, can significantly influence A1C values. For example, consuming high-fiber foods like avocados and berries can help regulate blood sugar levels.
What is the correlation between regular A1C testing and health outcomes?
Statistical analyses indicate that regular A1C testing is directly correlated with improved health outcomes, highlighting its critical role in managing blood sugar conditions.
What are the financial implications of diabetes management?
Between 2012 and 2022, excess medical expenses linked to diabetes increased from $10,179 to $12,022 per individual, indicating a growing financial burden on patients and the healthcare system.
How does the A1C test function within a healthcare team?
The A1C test serves as a measure of glycemic control and is essential in an interprofessional healthcare team, aiding in effective diabetes management.
What role do community wellness programs play in diabetes management?
Community wellness programs can provide personalized guidance, group support, and resources that enhance regular A1C testing and overall diabetes care.
How can A1C results be converted to estimated average glucose (eAG)?
The formula to convert A1C to eAG is: eAG (mg/dL) = (A1C × 28.7) – 46.7. For example, an A1C of 7% corresponds to an average blood sugar level of approximately 154 mg/dL.
What A1C levels are recommended for individuals with type 2 diabetes?
Individuals with type 2 diabetes are advised to maintain an A1C of less than 7-8%, as recommended by the American Academy of Family Physicians.
What strategies can enhance blood sugar control?
Strategies for better blood sugar control include frequent blood glucose testing, carbohydrate counting, stress reduction, and utilizing tracking methods like fitness apps and journals.
Why is it important to regularly review progress in diabetes management?
Regularly reviewing progress fosters accountability and allows for the adaptation of goals based on changing fitness levels, which can enhance overall diabetes management.


