Introduction
In the realm of diabetes management, the A1C test emerges as a pivotal indicator of blood sugar control, offering insights that can significantly influence treatment decisions. This comprehensive examination of glycated hemoglobin not only aids in diagnosing diabetes but also plays a crucial role in monitoring patients’ long-term glucose levels.
As healthcare providers and patients alike strive for optimal management strategies, understanding A1C levels becomes essential. This article delves into the importance of the A1C test, its implications for blood sugar management, and the recommended practices for monitoring and setting personalized goals.
By exploring the nuances of A1C testing, individuals can empower themselves with the knowledge necessary to navigate their diabetes journey effectively.
Understanding the A1C Test: Importance and Functionality
The A1C test, often known as glycated hemoglobin, acts as an essential instrument in assessing the average blood sugar readings, as indicated by the a1c to blood sugar level chart, over the prior two to three months. This test is indispensable for diagnosing and monitoring the condition, as it provides a thorough overview of the a1c to blood sugar level chart. By understanding the a1c to blood sugar level chart, both patients and healthcare providers can make well-informed decisions regarding their treatment plans.
Typically conducted via a simple blood draw during regular check-ups, the A1C test is advised at least twice a year for individuals with stable blood sugar control, and more often for those whose treatment plans are being modified. Consistent tracking of A1C readings with the a1c to blood sugar level chart can reveal patterns in blood sugar regulation, thus demonstrating the efficacy of a patient’s management plan. Recent studies emphasize that women with HbA1c levels between 5.7% and 6.4% have a significantly higher risk of progression to gestational glucose intolerance (GDM) compared with women with normal HbA1c values and should be considered for closer GDM monitoring and possible intervention, as noted by Kwon et al.
Furthermore, the American Diabetes Association recommends using HbA1c with a cut-point of ≥6.5% for diagnosing the condition, as it provides a reliable measure of chronic glycemia that can be referenced in the a1c to blood sugar level chart and correlates with long-term complications. This reinforces the A1C test’s role as the preferred method for long-term glycemic monitoring, as shown in the a1c to blood sugar level chart, despite ongoing debates surrounding its diagnostic cut-point. Additionally, it is crucial to address the root causes of this condition through a holistic regimen that empowers patients to manage their health effectively.
Recognizing the anxiety that can accompany concerns about potential complications of this condition is essential in this journey. Notably, 93.0% of patients had their cholesterol checked, emphasizing the importance of regular health checks, including A1C testing, in comprehensive diabetes management.
A1C Levels and Blood Sugar: What the Numbers Mean
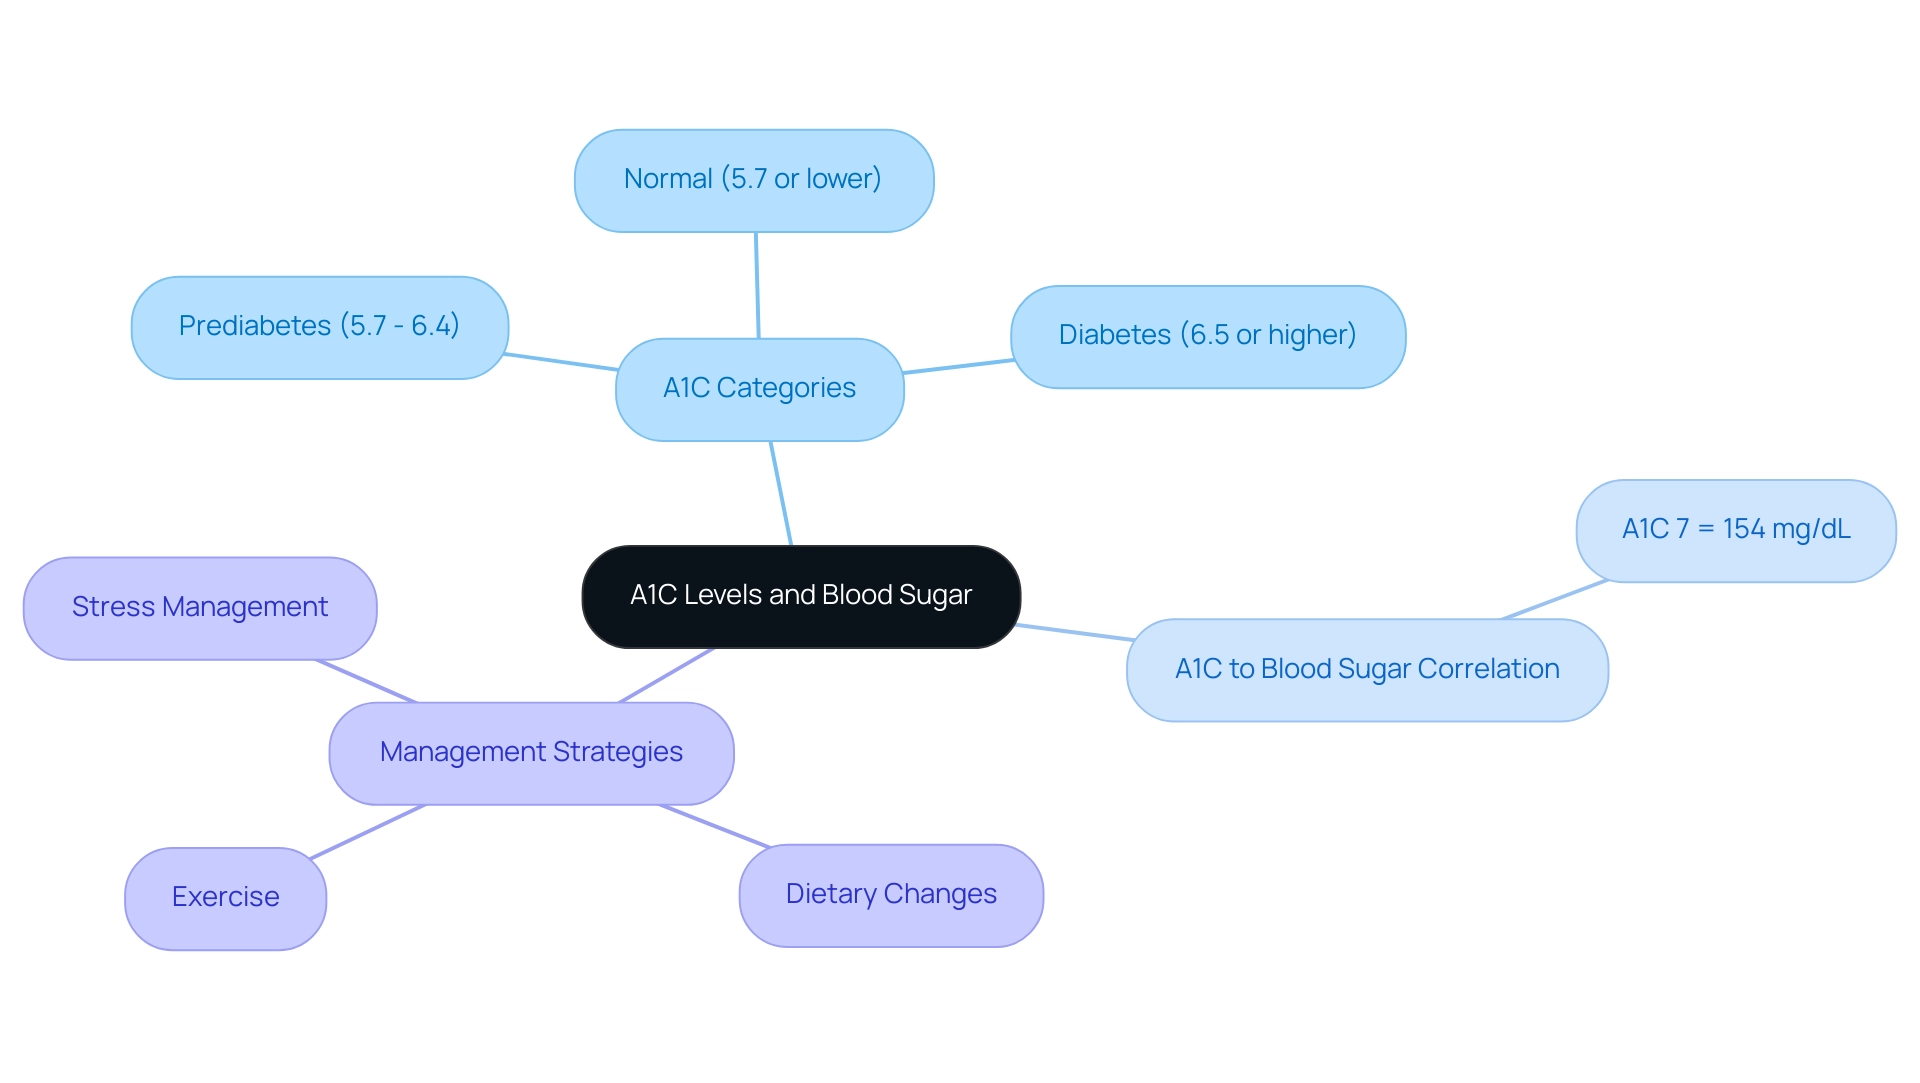
A1C values, expressed as a percentage, represent the proportion of glycated hemoglobin in the bloodstream. An A1C reading of 5.7% or lower is categorized as normal, while values from 5.7% to 6.4% suggest prediabetes. A reading of 6.5% or higher validates a diagnosis of blood sugar disorder.
For individuals managing type 2 sugar condition, understanding the connection between A1C values and the a1c to blood sugar level chart is essential. For instance, an A1C of 7% typically correlates with the a1c to blood sugar level chart measurement of approximately 154 mg/dL. Roopa Naik highlights the importance of these metrics in blood sugar care, stating, ‘Understanding A1C levels is vital for effective treatment strategies.’
Furthermore, a recent case study titled ‘Comparative Effectiveness of GDM Screening Methods‘ discovered that the one-step approach using IADPSG criteria identified twice as many individuals with gestational conditions, highlighting the significance of precise A1C interpretation in screening and overall oversight. Additionally, adopting a holistic approach to managing health conditions, as practiced at the Integrative Wellness Center, empowers patients to address root causes and make informed lifestyle adjustments. This method not only alleviates the anxiety surrounding potential complications of the condition but also emphasizes the importance of specific treatment strategies, such as:
- Dietary changes
- Exercise
- Stress management techniques
This comprehensive understanding of A1C levels, as demonstrated by the a1c to blood sugar level chart, not only aids in effective self-care but also challenges traditional treatment myths, paving the way for transformative patient success stories in reversing type 2 conditions.
Setting Your A1C Goals: Recommended Targets for Diabetics
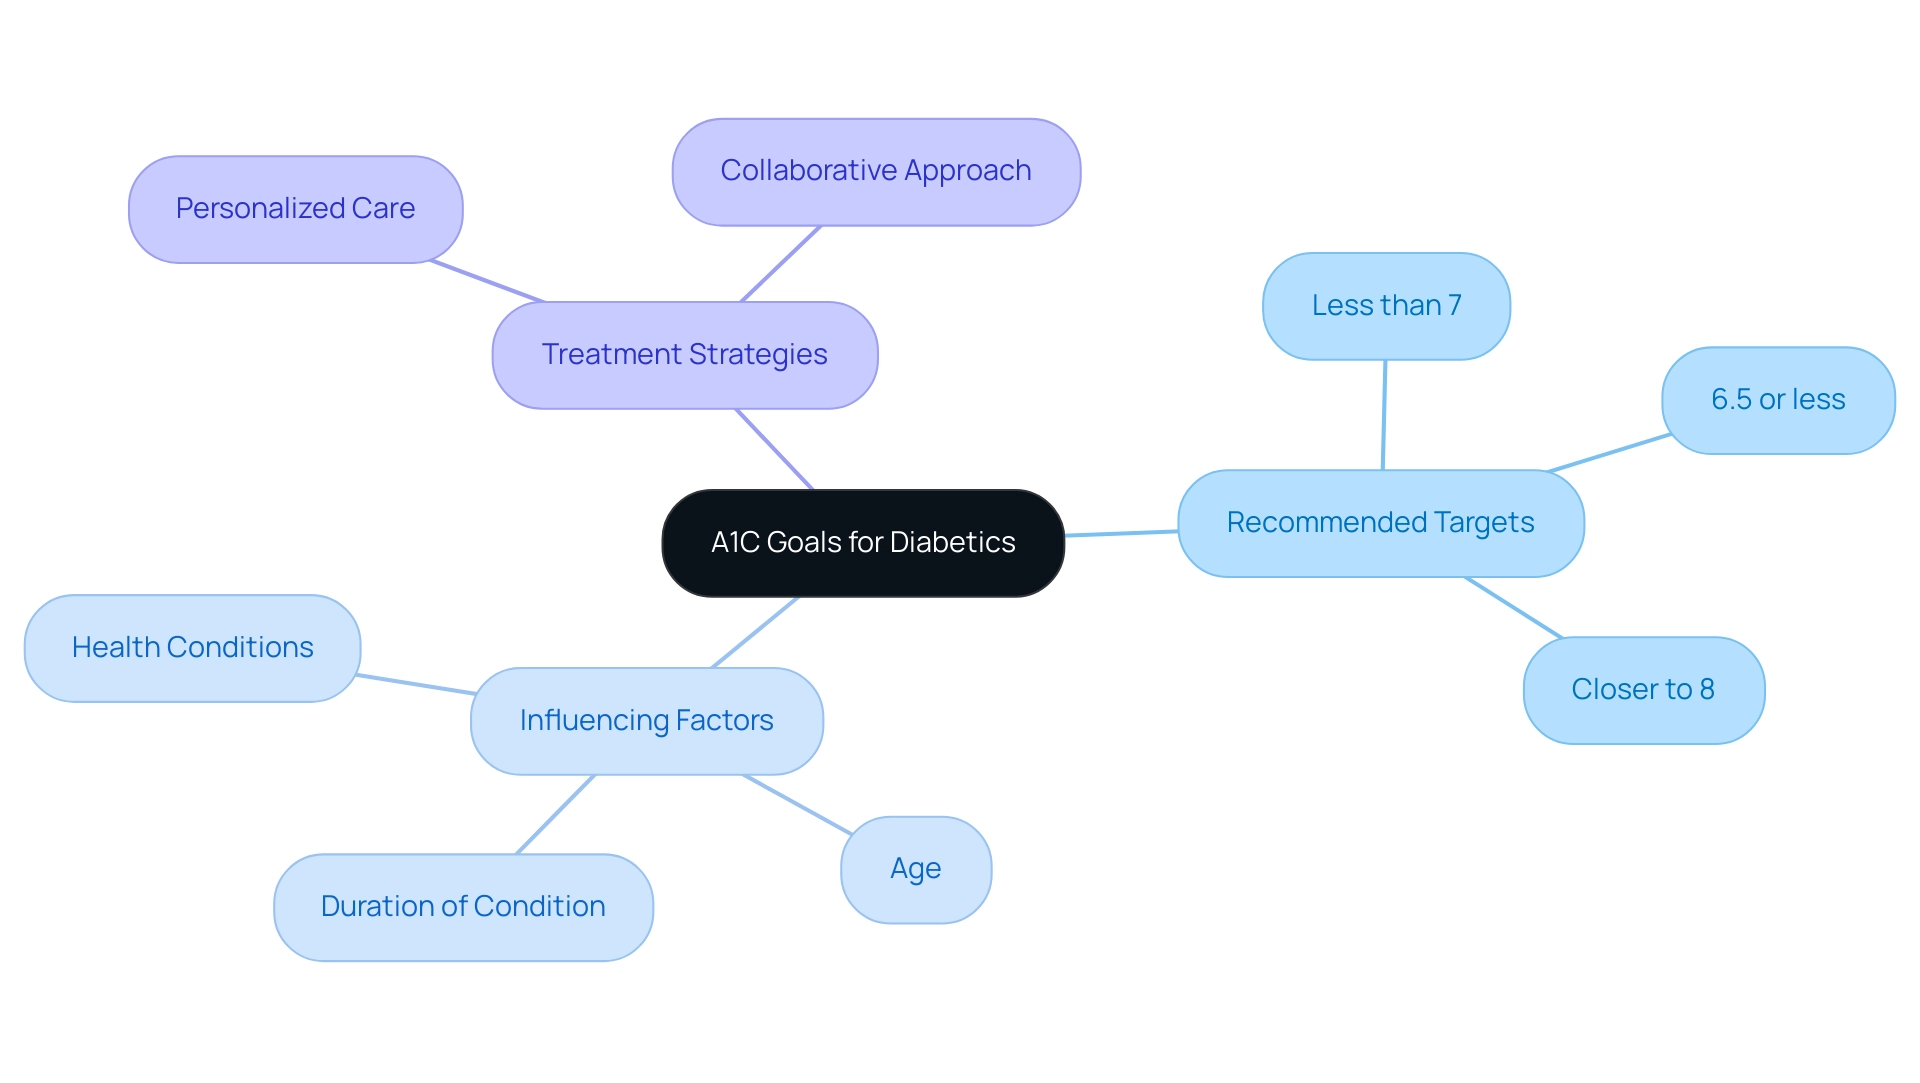
The American Diabetes Association currently recommends using an A1C to blood sugar level chart with a goal of less than 7% for many individuals with the condition. However, it is essential to recognize that these targets should be individualized, taking into account factors such as health conditions, age, and the duration of the condition. For instance, a more stringent A1C target of 6.5% or less may be appropriate for some patients, while older adults or those with additional health complications might aim for a target closer to 8%.
Historical data indicates that in 1999, the percentage of individuals reaching A1C goals was 44.9%, emphasizing the progress and continuing challenges in managing the condition. At the Integrative Wellness Center, we emphasize a holistic approach to reversing type 2 by re-examining the source of your condition and addressing root causes through functional medicine. This approach not only aims to enhance health outcomes but also to alleviate the anxiety that often accompanies concerns about possible complications related to this condition.
The 2024 guidelines emphasize that treatment plans for older adults with blood sugar issues and comorbidities should include agents that minimize cardiorenal risks, regardless of glycemia. This aligns with our philosophy of empowering patients through personalized care, as illustrated by transformative patient experiences shared in our testimonials, where clients have reported significant improvements in their health and well-being. Recent case studies also showcase the importance of structured diagnostic testing and confirmatory testing for abnormal results.
Collaborating closely with healthcare providers is crucial for determining the most suitable A1C target, as referenced in the A1C to blood sugar level chart, ensuring that treatment strategies are aligned with each individual’s unique circumstances and health conditions. Furthermore, Recommendation 8.17 proposes the use of GLP-1 receptor agonists or a dual GIP and GLP-1 receptor agonist as preferred pharmacotherapy for obesity treatment, further highlighting the necessity for personalized care in blood sugar control. As noted by the American Diabetes Association Professional Practice Committee, ‘For people with type 2 conditions, the discontinuation of all medications may be a reasonable approach, as these individuals are unlikely to have any oral intake.’
This perspective reinforces the necessity of tailored interventions in managing diabetes-related conditions.
Monitoring Your A1C: Frequency and Best Practices
The frequency of A1C testing is mainly influenced by the degree of diabetes control an individual attains as indicated by the a1c to blood sugar level chart. For patients who consistently meet their treatment goals and maintain stable blood glucose readings, testing every six months is often sufficient. However, for those experiencing changes in their treatment regimen or whose blood sugar readings are not well-regulated, more frequent testing—typically every three months—may be necessary.
The American Diabetes Association stresses the significance of monitoring these measurements, stating,
‘Tracking A1C results over time with the a1c to blood sugar level chart is essential for identifying patterns that can inform treatment adjustments.’ Interacting with healthcare providers regarding the a1c to blood sugar level chart enables prompt adjustments to control strategies, ultimately resulting in better blood sugar regulation. Furthermore, recognizing that a 2-hour post-glucose challenge level between 140 mg/dL (7.8 mmol/L) and 199 mg/dL (11.0 mmol/L) signifies impaired glucose tolerance emphasizes the essential function of regular testing in managing blood sugar levels.
As part of a holistic approach at the Integrative Wellness Center, we emphasize addressing the root causes of this condition, empowering patients through education and functional medicine. This approach not only aims to enhance physical health but also seeks to alleviate the anxiety surrounding potential complications of the condition, allowing patients to find new peace in their lives. Furthermore, as part of the 2024 Standards of Care, recommendations have been updated to ensure that healthcare professionals provide the most current information for effective treatment planning.
It is also essential to consider Recommendation 5.51, which promotes sleep health routines and habits as part of a comprehensive management strategy. Lastly, insights from the case study titled ‘Cost Updates for Diabetes Agents’ underscore the need for patients to stay informed about the financial aspects of their treatment options, ensuring they can make educated decisions regarding their care. By re-evaluating the cause of diabetes, we can establish a comprehensive regimen that addresses health at its foundation.
Tools for Managing A1C: Calculators and Resources
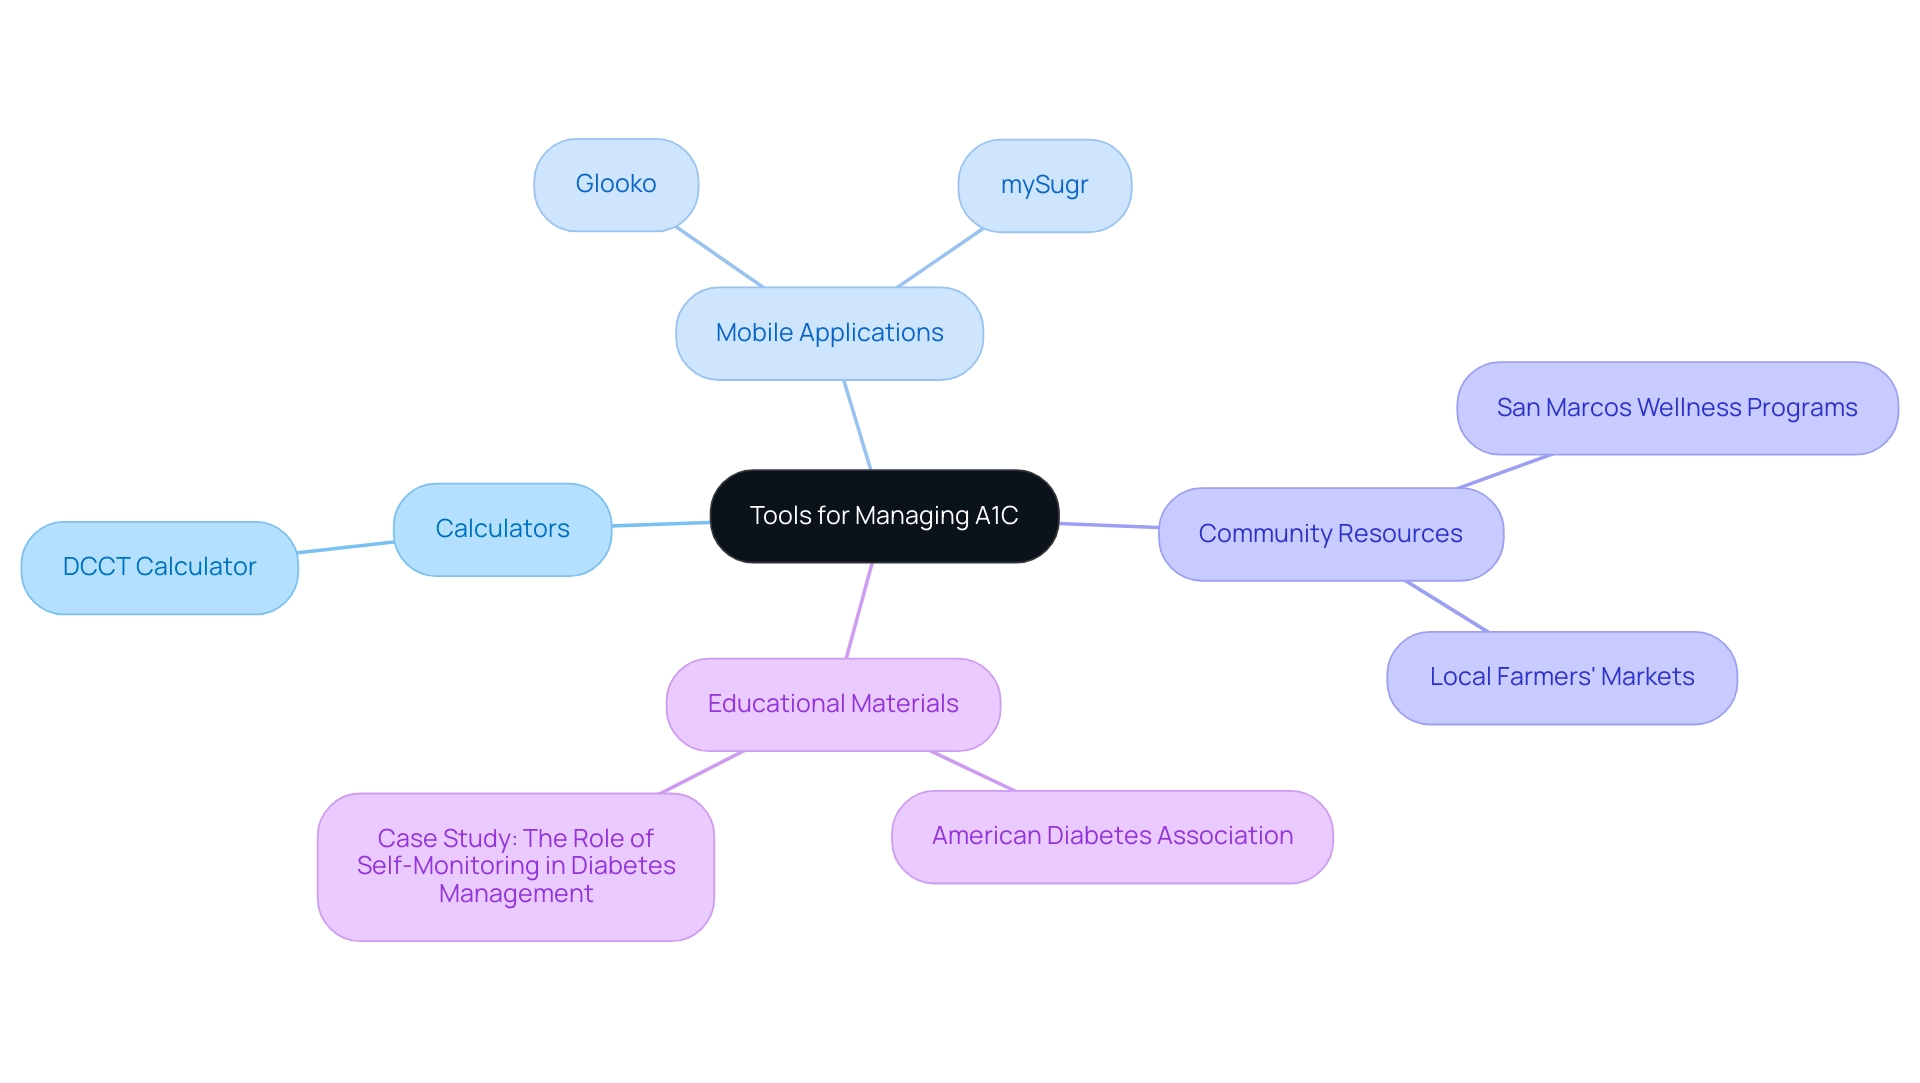
A wide array of online calculators and mobile applications are available to assist individuals in monitoring their blood glucose readings and understanding their A1C results using the a1c to blood sugar level chart. Among these, the Diabetes Control and Complications Trial (DCCT) calculator stands out as a valuable tool, providing insights into how daily blood glucose readings relate to the a1c to blood sugar level chart. With around 2.4 million continuous glucose monitoring (CGM) users in the United States, the importance of technology in overseeing blood sugar levels is clear.
Additionally, resources from esteemed organizations such as the American Diabetes Association provide essential educational materials and support for effective management of the condition. Tools like Glooko, which enable users to share reports with healthcare providers in various formats, enhance communication and support in managing blood sugar levels. Embracing these tools encourages a proactive approach to health management, empowering patients to eliminate anxiety regarding complications through holistic education and community support.
Furthermore, participating in community wellness programs in San Marcos can offer extra resources designed for managing blood sugar levels. Real-world examples, such as the case study titled ‘The Role of Self-Monitoring in Diabetes Management,’ exemplify the effectiveness of these resources, emphasizing that while A1C is valuable, it should be complemented with frequent self-monitoring of blood glucose. Diabetes educators also highlight the importance of integrating these calculators and apps, as they enhance understanding of blood sugar control and facilitate better health outcomes, especially when utilizing an a1c to blood sugar level chart to support a lifestyle rich in nutrition and community engagement.
To further enhance diabetes management, individuals are encouraged to embrace the outdoor lifestyle by utilizing local parks and trails for regular exercise. A balanced diet rich in local produce, such as avocados and berries, is also beneficial. Participating in local farmers’ markets can provide fresh, nutritious options that support overall health and blood sugar regulation.
Conclusion
Understanding and effectively managing A1C levels is paramount for individuals navigating diabetes. The A1C test serves as a cornerstone in diagnosing and monitoring blood sugar control, providing valuable insights that inform treatment strategies. Regular testing not only helps track progress but also empowers patients to make informed decisions regarding their health. By recognizing the significance of A1C levels, individuals can understand their diabetes status and take proactive steps towards achieving their personal health goals.
Setting individualized A1C targets is essential, as these goals should reflect each person’s unique health circumstances, age, and duration of diabetes. The American Diabetes Association’s guidelines emphasize the importance of tailoring treatment plans to optimize outcomes. This personalized approach, complemented by frequent monitoring and the use of innovative tools, enhances the management of diabetes, ensuring individuals can maintain stable blood sugar levels and reduce the risk of complications.
Ultimately, a holistic approach that addresses the root causes of diabetes, combined with the right resources and support, can lead to transformative health outcomes. By integrating lifestyle changes, utilizing available technologies, and engaging with healthcare providers, individuals can navigate their diabetes journey with confidence. Emphasizing knowledge and empowerment will not only foster better health management but also cultivate a sense of agency in controlling one’s diabetes.
Frequently Asked Questions
What is the A1C test and why is it important?
The A1C test, also known as glycated hemoglobin, measures average blood sugar levels over the past two to three months. It is crucial for diagnosing and monitoring diabetes, as it helps both patients and healthcare providers make informed treatment decisions.
How often should the A1C test be conducted?
The A1C test is recommended at least twice a year for individuals with stable blood sugar control, and more frequently for those whose treatment plans are being adjusted.
What do the A1C values indicate?
A1C values are expressed as percentages: 5.7% or lower is considered normal, 5.7% to 6.4% indicates prediabetes, and 6.5% or higher confirms a diagnosis of diabetes.
How does an A1C reading correlate with blood sugar levels?
For example, an A1C of 7% typically corresponds to an average blood sugar level of approximately 154 mg/dL, as indicated by the a1c to blood sugar level chart.
What does recent research suggest about women with specific A1C levels?
Studies show that women with HbA1c levels between 5.7% and 6.4% are at a higher risk for developing gestational glucose intolerance and may require closer monitoring and intervention.
What is the American Diabetes Association’s recommendation for diagnosing diabetes using A1C?
The ADA recommends using an HbA1c cut-point of ≥6.5% for diagnosing diabetes, as it reliably measures chronic glycemia and correlates with long-term complications.
What holistic approaches can help manage blood sugar levels?
Effective management strategies include dietary changes, exercise, and stress management techniques, which empower patients to address root causes of their condition.
How does regular health monitoring relate to diabetes management?
Regular health checks, including A1C testing, are vital in comprehensive diabetes management, as evidenced by the fact that 93.0% of patients had their cholesterol checked.
What is the significance of understanding A1C levels for treatment strategies?
Understanding A1C levels is essential for developing effective treatment strategies, as it aids in self-care and challenges traditional treatment myths, leading to better health outcomes.


