Introduction
The A1C test serves as a critical tool in the management of diabetes, providing insights into average blood glucose levels over a two to three-month period. Understanding the significance of this test is essential for individuals navigating the complexities of diabetes care.
With defined thresholds indicating normal, prediabetic, and diabetic states, the A1C measurement empowers patients to make informed decisions about their health.
Regular monitoring is not merely a recommendation; it is a vital practice that can mitigate risks associated with the disease and enhance overall well-being.
This article delves into the intricacies of the A1C test, its implications for blood glucose management, and actionable strategies for lowering A1C levels effectively, all while emphasizing the importance of a holistic approach to diabetes care.
Understanding the A1C Test and Its Importance
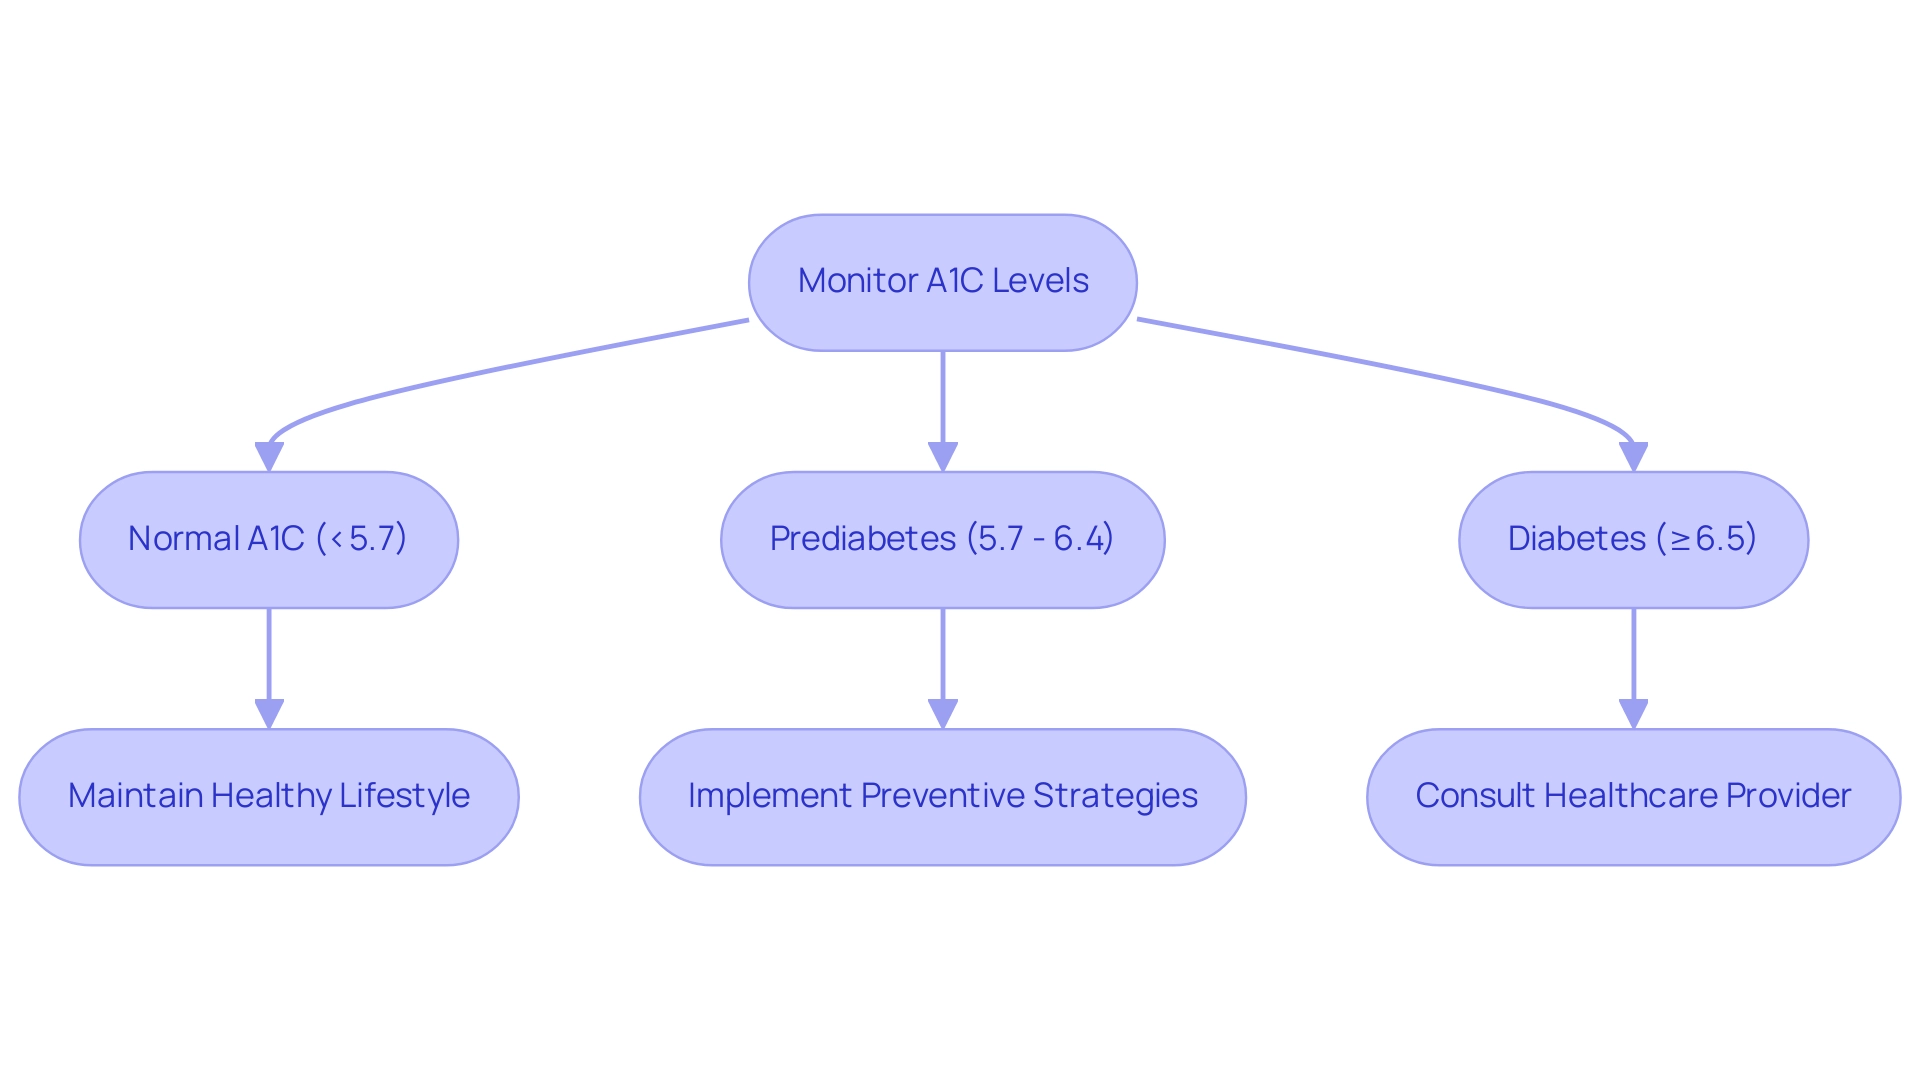
The A1C test is an essential diagnostic instrument that measures the percentage of glycated hemoglobin proteins in plasma, which is crucial for understanding the a1c to blood glucose chart as it indicates increased glucose concentrations. This test not only provides a retrospective perspective of average blood glucose readings over the prior two to three months but also establishes a framework that incorporates the a1c to blood glucose chart for efficient management of the condition. Normal A1C levels are defined as being below 5.7%.
Levels between 5.7% and 6.4% signal prediabetes, while an A1C of 6.5% or higher is indicative of the condition. Maintaining awareness of these thresholds, particularly as indicated on the a1c to blood glucose chart, is crucial for individuals managing their condition, as this knowledge empowers patients to take proactive steps towards their health. Regular testing is not just a recommendation; it is a necessary practice for monitoring disease progression and making informed adjustments to the a1c to blood glucose chart in treatment plans.
By effectively monitoring A1C levels with the a1c to blood glucose chart, individuals can maintain optimal blood sugar control, reduce risks associated with the condition, and alleviate anxiety related to complications. To further enhance health and potentially reverse this condition, consider incorporating lesser-known strategies such as:
- Mindful eating
- Stress reduction techniques
- Community support systems that foster a sense of belonging and accountability
The significance of monitoring diabetes-related health outcomes is underscored by the Monitoring Nephropathy rate for Commercial HMO at 36.0%, as noted in 1999.
M.M.-B. has reviewed and edited this information, ensuring its accuracy. Furthermore, the economic impact of this condition is substantial; in 2012, the estimated direct and indirect costs in the U.S. totaled $245 billion, which highlights the necessity of effective management strategies such as utilizing an A1C to blood glucose chart for regular testing to prevent costly complications.
Embracing a holistic approach to care not only addresses the medical aspects but also empowers patients through education and support, ultimately leading to transformative health solutions while alleviating worries about complications.
Interpreting A1C Results: What They Mean for Blood Glucose Levels
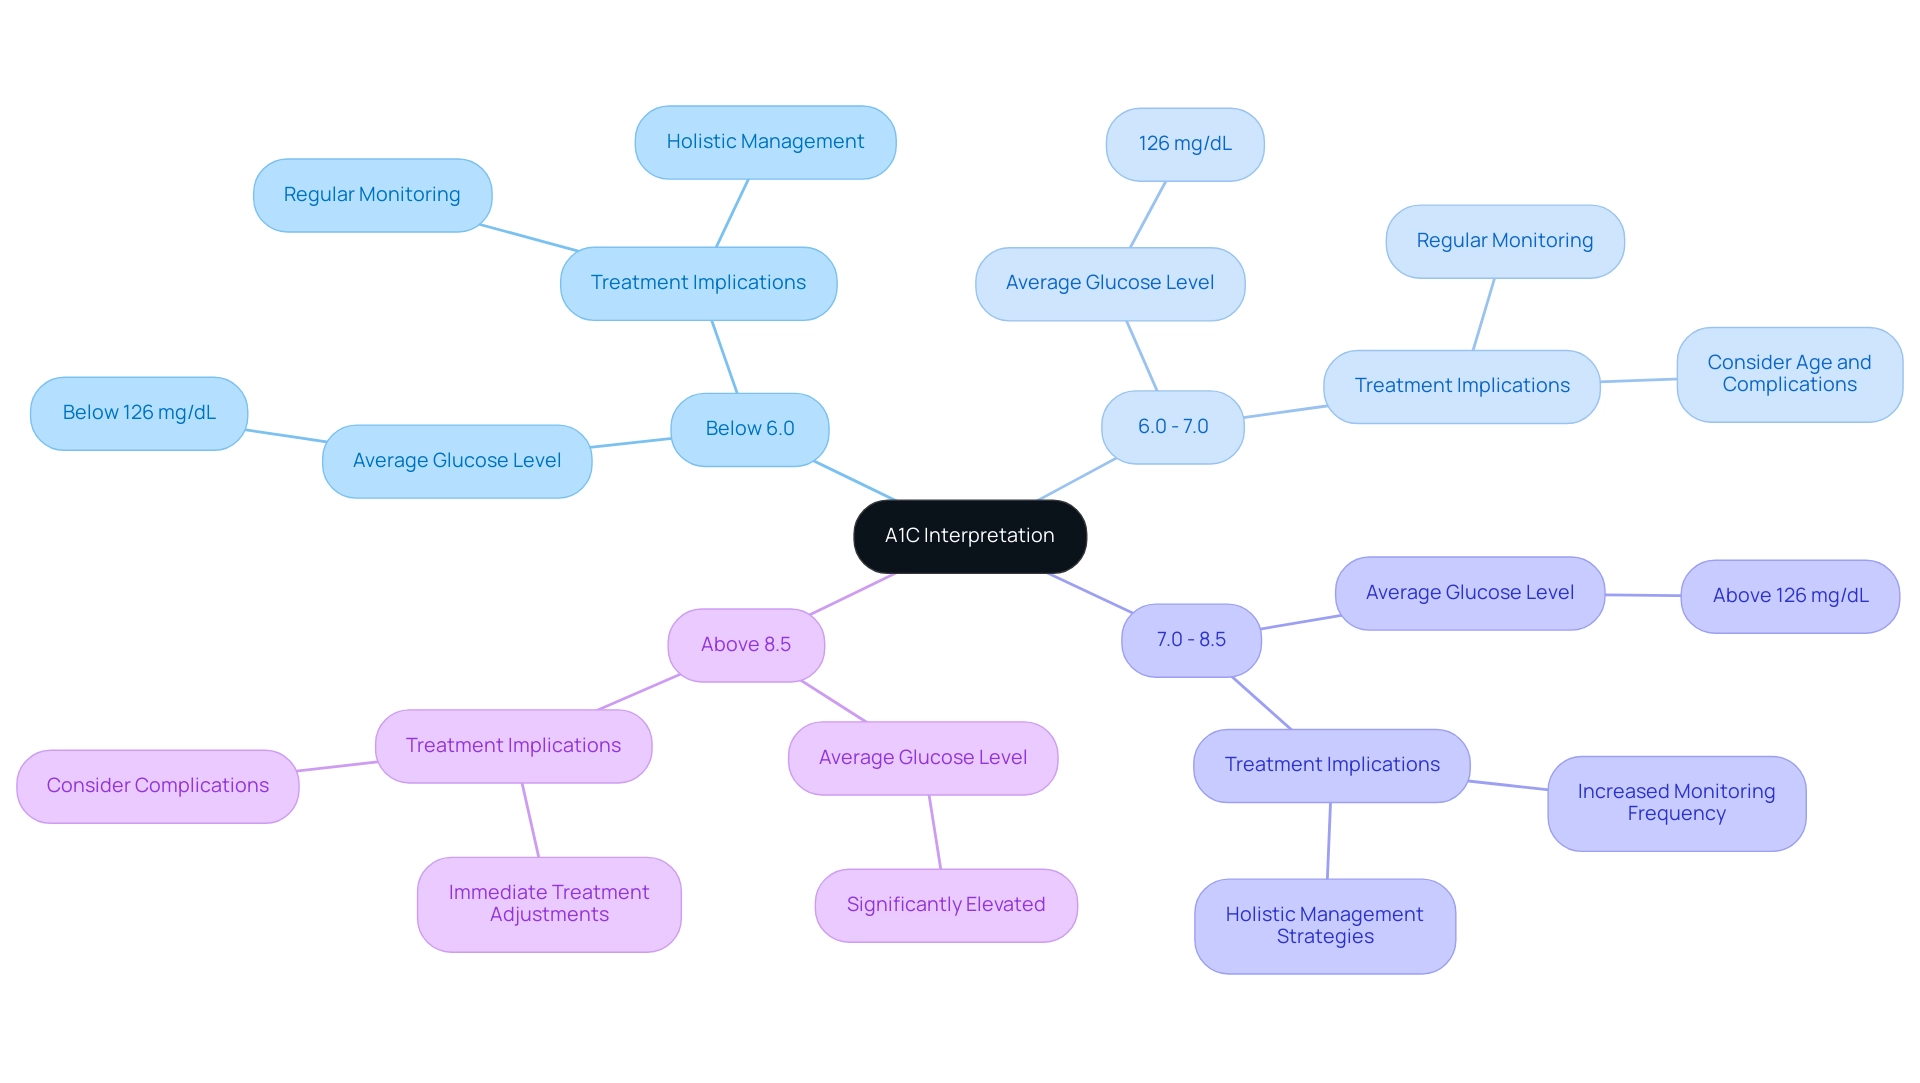
A1C results are shown as a percentage, and according to the a1c to blood glucose chart, an A1C of 6.0% indicates an average glucose level of approximately 126 mg/dL. This direct correlation is crucial for individuals managing their condition, as it enables them to effectively evaluate their blood sugar control using the a1c to blood glucose chart. At the Integrative Wellness Center, we emphasize a holistic approach to addressing the root causes of this condition, empowering patients to manage their health proactively.
For optimal management of the condition, it is essential to adhere to the A1C target established by your healthcare provider, as shown on the a1c to blood glucose chart. Generally, a target of below 7.0% is recommended for many adults with this condition. However, for older adults or those with complications, A1C targets may be set between 7.0% and 8.5%.
Individuals who meet their treatment goals may need an A1C test twice a year, underscoring the importance of regular monitoring. As Vivian Fonseca observed in her editorial, ‘Translating the hemoglobin A1C assay’ (Diabetes Care, 2008), comprehending A1C values is crucial for efficient management of the condition. Consistently examining the a1c to blood glucose chart offers important understanding, assisting individuals in recognizing trends in their glucose readings and encouraging essential lifestyle modifications to sustain optimal health.
A1C tests are also used to assess for prediabetes or high sugar conditions, reinforcing their role in monitoring glucose concentrations. One patient, John, shared, ‘After starting the holistic regimen at the Integrative Wellness Center, my A1C dropped from 8.5% to 6.2% in just six months. I feel more in control of my health than ever before.’
This testimonial highlights the transformative experiences that patients can achieve through a comprehensive approach to diabetes management.
Step-by-Step Guide to Using the A1C to Blood Glucose Chart
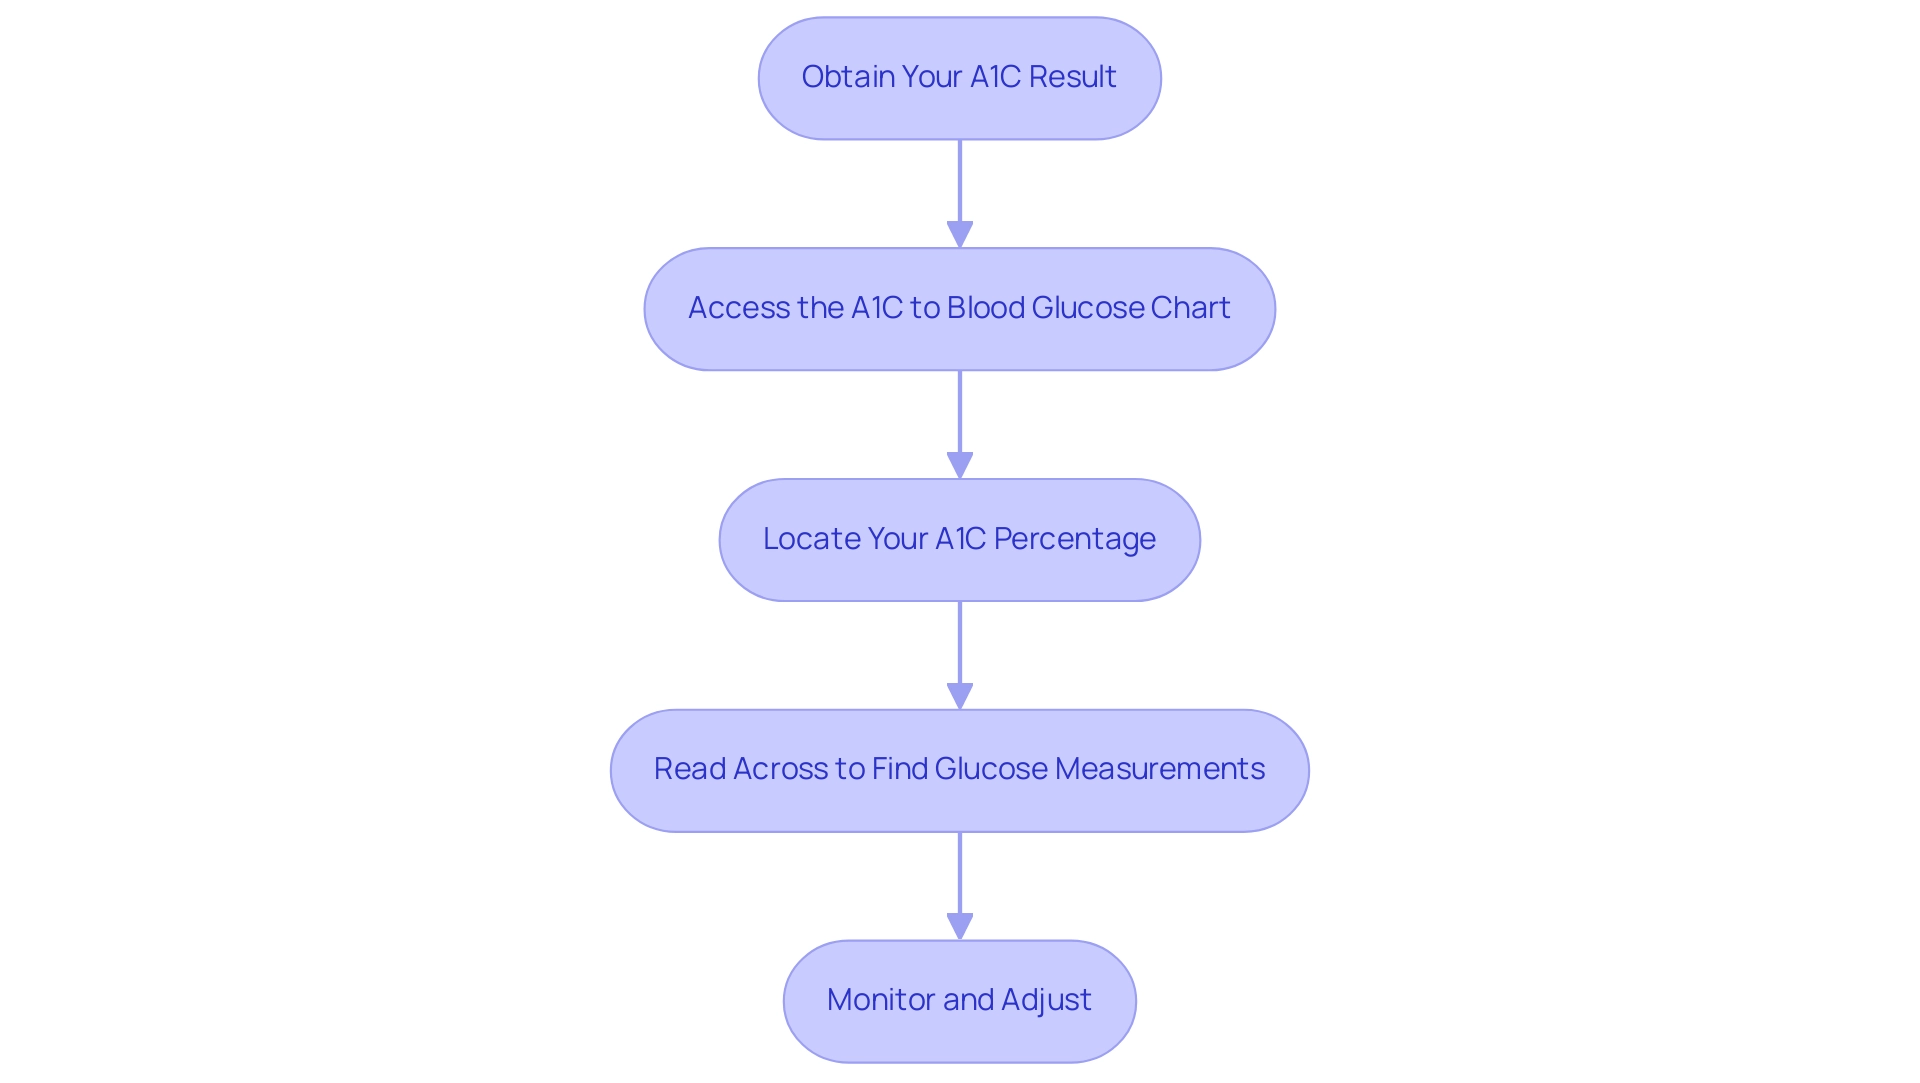
- Obtain Your A1C Result: Start by acquiring your most recent A1C test result from your healthcare provider. This figure is generally represented as a percentage of hemoglobin that is glycated, offering essential insights into your average glucose concentrations over the past two to three months.
- Access the a1c to blood glucose chart: Locate a reliable a1c to blood glucose chart, which typically lists various A1C percentages alongside their corresponding average glucose amounts measured in mg/dL. This chart serves as a key tool for understanding your sugar management.
- Locate Your A1C Percentage: On the chart, identify your specific A1C percentage. This step is essential as it establishes the foundation for understanding your glucose readings.
- Read Across to Find Glucose Measurements: Once you have identified your A1C percentage, use the a1c to blood glucose chart to ascertain the corresponding average glucose concentration in mg/dL. This correlation is essential for assessing your glycemic control.
- Monitor and Adjust: Use the data collected from the chart to keep track of your glucose measurements. It is advisable to discuss any necessary adjustments or changes in your management plan with your healthcare provider, especially since recent findings indicate that low fasting glucose readings may signal underlying medical conditions, such as adrenal or pituitary gland disorders. Moreover, using a continuous glucose monitor (CGM) can assist in removing the necessity for frequent finger pricks and enhance comprehension of how your sugar concentrations vary daily. As pointed out by Sarah Jayawardene, MS, ‘Utilizing a continuous glucose monitor is the favored approach for measuring and tracking sugar, as it demonstrates how your personal amounts fluctuate daily.’ Furthermore, monitoring both spikes and dips in blood sugar levels is crucial for understanding diet and lifestyle impacts on health, as highlighted in the case study titled ‘Importance of Monitoring Blood Sugar.’ Chronic glycemia (A1C) is typically expressed as a percentage of hemoglobin that is glycated, making it essential to integrate this understanding into your blood sugar management. By addressing the root causes of your condition and being aware of the potential dangers of traditional treatments, such as insulin resistance and other complications, you can empower yourself towards better health at the Integrative Wellness Center. It’s important to acknowledge the anxiety that often accompanies the fear of complications from this condition; recognizing this can help you take proactive steps in your health journey.
Common Questions About A1C and Blood Glucose Levels
Comprehending the difference between A1C and daily glucose measurements is essential for effective management of the condition, particularly since the A1C to blood glucose chart indicates that Type 2 accounts for 90–95% of all cases. A1C testing assesses the average blood glucose readings over a duration of 2 to 3 months, offering a wider view on glucose management, which can be visualized in the A1C to blood glucose chart, while daily blood glucose measurements indicate current amounts that can fluctuate greatly during the day. This dual approach not only offers a comprehensive view of managing the condition but also empowers patients to navigate their treatment plans effectively, alleviating the anxiety that often accompanies concerns about potential complications of the disease.
In terms of A1C testing frequency, it is generally advised to have this test conducted every three months. However, individual circumstances may necessitate more frequent evaluations. As health educators often suggest, it is crucial to discuss with your healthcare provider any pertinent factors impacting your well-being to guarantee optimal monitoring customized to your individual requirements.
A1C values can vary due to several influences, including dietary choices, physical activity, and underlying health conditions. Acknowledging that the danger of developing the condition rises steadily at elevated glucose amounts emphasizes the significance of consistent observation in comprehending these alterations and their effects on managing the illness, particularly when referring to the A1C to blood glucose chart. Furthermore, diagnosing monogenic conditions should be considered in children and adults identified with this disorder in early adulthood under specific findings, emphasizing the complexity of diagnosis and the need for tailored monitoring strategies.
By staying informed about fluctuations in A1C and blood glucose levels, patients can make necessary adjustments in their care regimen, ultimately enhancing their overall health outcomes and embracing a holistic approach to reversing the condition.
Moreover, incorporating four lesser-known strategies—such as dietary adjustments, stress management techniques, regular physical activity, and community support programs—can significantly enhance health and empower patients in their journey towards reversing the illness. Engaging in community wellness programs can provide additional support and resources, fostering a sense of belonging and shared experience among those managing similar challenges.
Strategies for Lowering Your A1C Levels Effectively
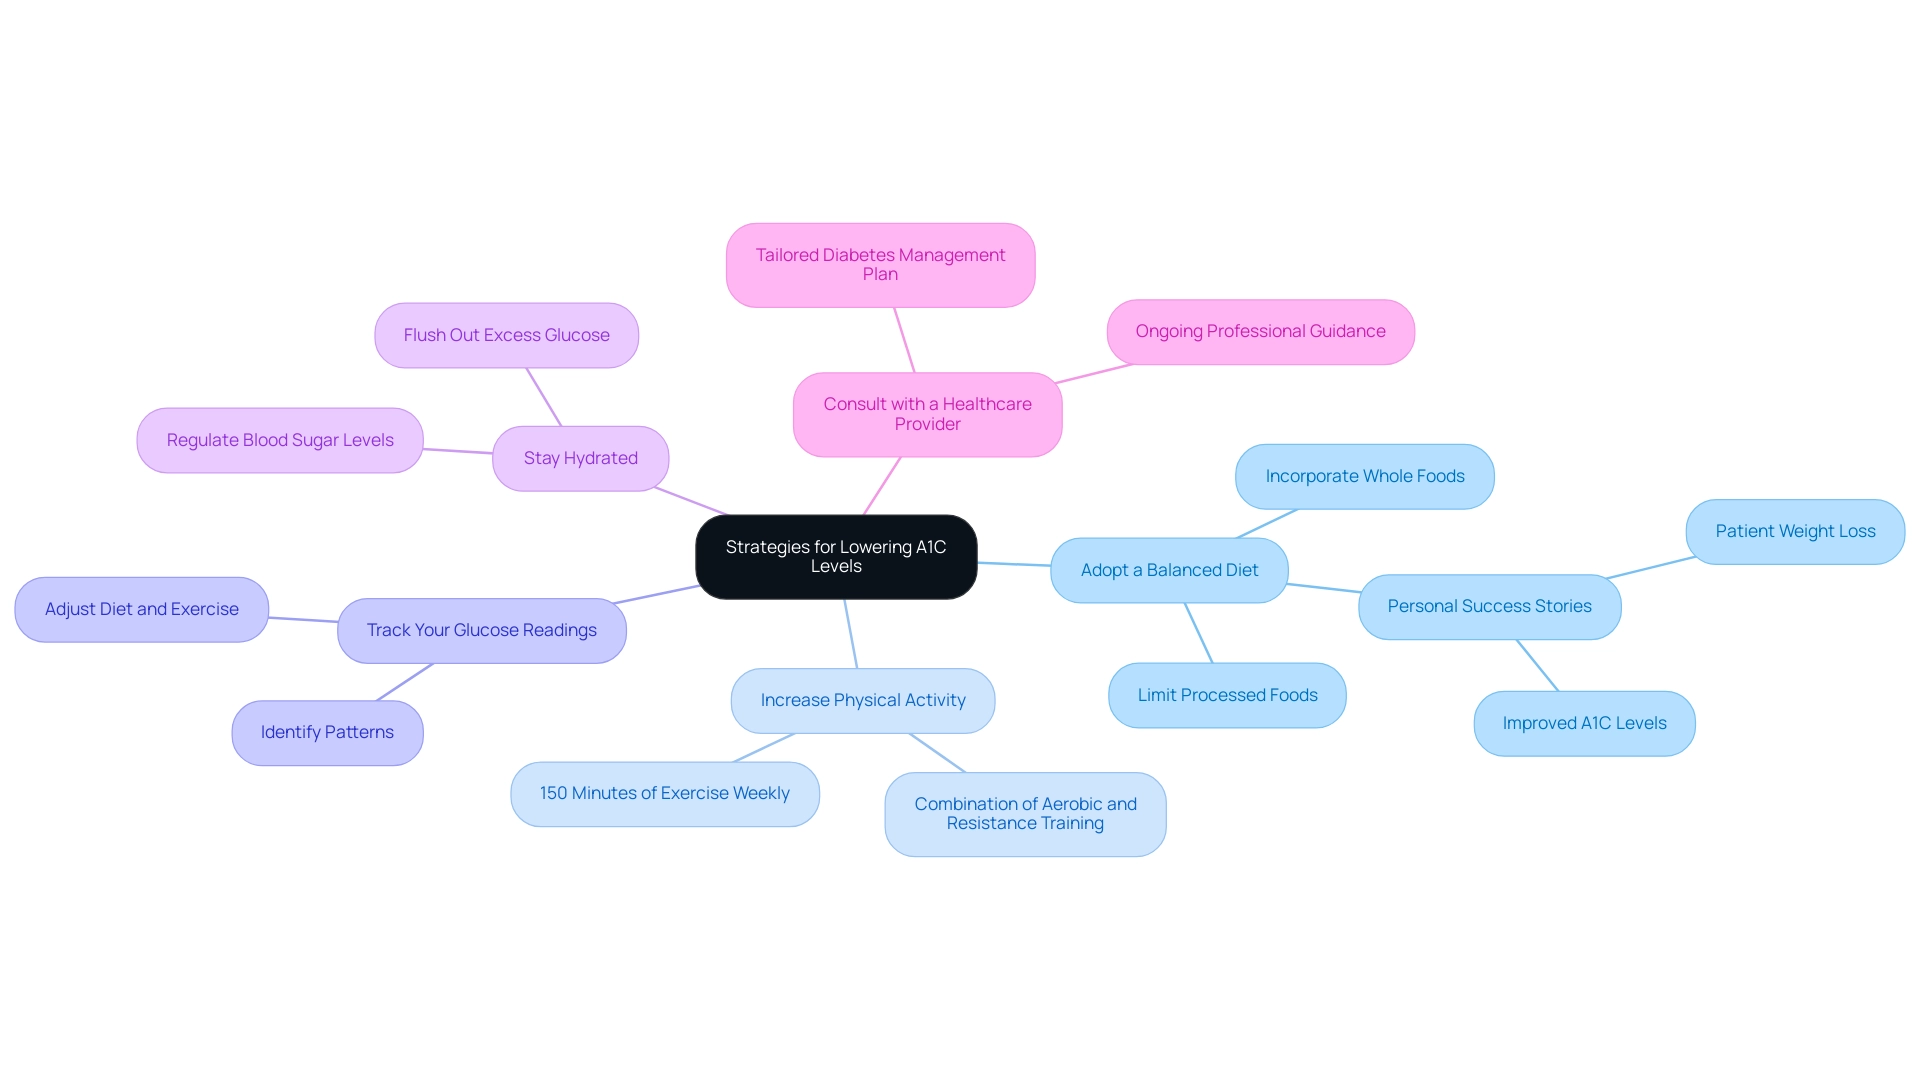
- Adopt a Balanced Diet: Emphasizing whole foods is crucial for effective management of blood sugar. Incorporate a variety of vegetables, lean proteins, and whole grains into your meals while limiting processed foods and added sugars. Recent studies indicate that a low-carbohydrate diet can be beneficial for improving glycemic markers, particularly for individuals at high risk of type 2 conditions. Hiroyuki Umegaki from the Department of Geriatrics at Nagoya University observes that dietary approaches are crucial in regulating blood sugar, stating, “Making informed food choices is essential for effectively managing the condition.” Additionally, in the low-fat diet group, 28 (56%) of participants were on cholesterol-lowering medication, highlighting the interconnectedness of diet and health outcomes related to managing blood sugar. A transformative patient success story from the Integrative Wellness Center illustrates this point: after committing to a holistic regimen that addressed the root causes of their condition, one patient shared, “I lost 55 lbs, reduced my A1C from 9.1 to 5.7, and normalized my fasting glucose level from 133 to 85, all while receiving personalized care that made me feel supported.” This holistic approach not only improved their numbers but also helped alleviate the anxiety surrounding their diabetes management.
- Increase Physical Activity: Engaging in at least 150 minutes of moderate exercise each week is recommended. Regular physical activity enhances insulin sensitivity, which is essential for sugar control. Fitness professionals advocate for a combination of aerobic and resistance training to maximize benefits. Significantly, this corresponds with results from a recent study showing that exercise not only reduces A1C values but also aids in overall health enhancements.
- Track Your Glucose Readings: Regular checking of glucose readings is crucial for understanding how various foods and physical activities influence your A1C to blood glucose chart. This practice can help identify patterns and make necessary adjustments to your diet and exercise regimen, which can be tracked using the a1c to blood glucose chart to foster better metabolic control.
- Stay Hydrated: Sufficient hydration is frequently ignored in managing blood sugar levels. Drinking sufficient water can aid in regulating blood sugar levels, as it helps the kidneys flush out excess glucose through urine. Staying hydrated should be a part of any effective blood sugar management strategy.
- Consult with a Healthcare Provider: Regular consultations with a healthcare professional are crucial for tailoring your diabetes management plan to your specific needs. They can provide personalized advice based on your health status, dietary habits, and exercise routines, ensuring that you adopt the most effective strategies for lowering your A1C levels. As evidenced by the success story from the Integrative Wellness Center, the strengths and limitations highlighted in recent studies suggest that while certain dietary approaches show promise, such as the low-carbohydrate diet, ongoing professional guidance is essential for achieving sustainable results and understanding the need for further research in this area.
Conclusion
Regular monitoring of A1C levels is an indispensable component of effective diabetes management. This test offers invaluable insights into average blood glucose levels over a two to three-month period, allowing individuals to understand their health status and make informed decisions. Recognizing the significance of A1C thresholds—normal, prediabetic, and diabetic—enables patients to take proactive steps towards maintaining optimal blood sugar control.
Interpreting A1C results in conjunction with daily blood glucose readings provides a comprehensive view of diabetes management. By utilizing tools such as the A1C to blood glucose chart, individuals can effectively track their progress and adjust their treatment plans as necessary. Furthermore, incorporating strategies like:
- Balanced nutrition
- Regular physical activity
- Ongoing healthcare consultations
can significantly lower A1C levels and enhance overall well-being.
In conclusion, a holistic approach to diabetes care not only addresses the medical aspects of the disease but also empowers patients through education and support. By actively engaging in their health journey, individuals can alleviate concerns about complications and improve their quality of life. Embracing regular A1C testing and implementing effective management strategies is essential for navigating the complexities of diabetes and achieving lasting health outcomes.
Frequently Asked Questions
What is the A1C test and what does it measure?
The A1C test is a diagnostic tool that measures the percentage of glycated hemoglobin proteins in plasma, indicating average blood glucose levels over the previous two to three months.
What are the normal A1C levels?
Normal A1C levels are defined as being below 5.7%.
What do different A1C levels indicate?
An A1C level between 5.7% and 6.4% indicates prediabetes, while an A1C of 6.5% or higher is indicative of diabetes.
Why is it important to monitor A1C levels?
Monitoring A1C levels is crucial for managing diabetes, as it helps individuals understand their blood glucose control and make informed health decisions.
How often should A1C testing be done?
Individuals who meet their treatment goals may need an A1C test twice a year, but this can vary based on individual health circumstances.
What is the recommended A1C target for many adults with diabetes?
A common target for many adults is below 7.0%, though targets may be higher for older adults or those with complications.
How does the A1C to blood glucose chart assist individuals?
The A1C to blood glucose chart helps individuals evaluate their blood sugar control by correlating A1C percentages with average glucose levels.
What are some strategies to enhance health and manage diabetes?
Strategies include mindful eating, stress reduction techniques, and participating in community support systems.
What economic impact does diabetes have in the U.S.?
In 2012, the estimated direct and indirect costs of diabetes in the U.S. totaled $245 billion, highlighting the need for effective management strategies.
How can a holistic approach benefit diabetes management?
A holistic approach addresses both medical and lifestyle factors, empowering patients with education and support for better health outcomes.


