Introduction
The A1C test, also known as the glycated hemoglobin test, plays a vital role in the management of diabetes by providing insights into average blood glucose levels over a two to three-month period. Understanding the significance of this test is essential for individuals living with diabetes, as maintaining an A1C level below 7% is linked to a decreased risk of serious complications, such as cardiovascular issues and neuropathy.
This article delves into the intricacies of the A1C test, exploring its implications for health management, the relationship between A1C levels and average blood glucose, and practical strategies for effective monitoring. Additionally, it highlights the alarming rise in diabetes prevalence and the economic burden associated with this chronic condition, emphasizing the necessity for regular testing and informed lifestyle choices to enhance health outcomes.
Through a comprehensive overview, readers will gain valuable knowledge to navigate their diabetes management effectively.
Understanding the A1C Test and Its Importance for Diabetics
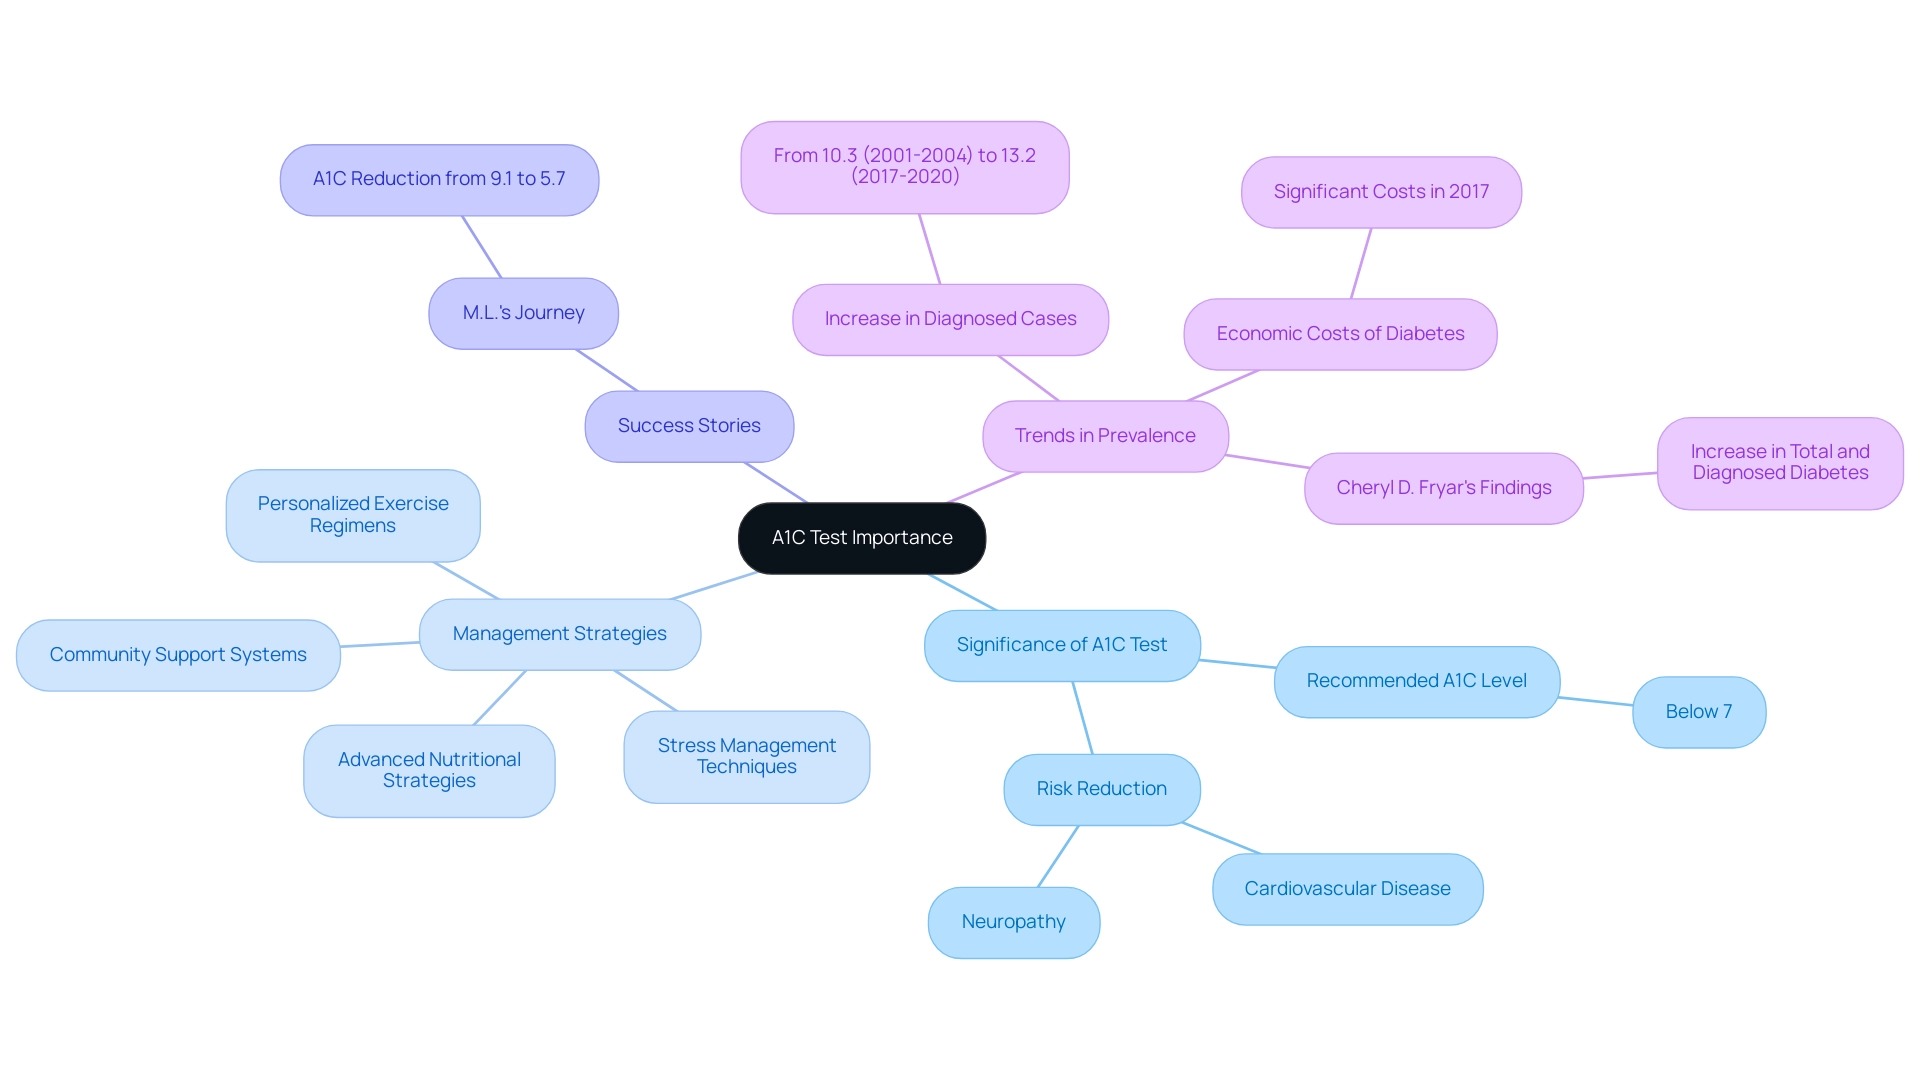
The A1C test, known as the glycated hemoglobin test, is an essential evaluation that measures the average blood sugar concentrations over the previous two to three months. Results are expressed as a percentage; increased percentages suggest higher blood sugar concentrations over time. For individuals diagnosed with this condition, especially those seeking transformative health solutions, a common recommendation is to maintain an A1C level below 7%, as this threshold is associated with a significantly reduced risk of complications, including cardiovascular disease and neuropathy.
Understanding the implications of the A1C test is essential for effective management of the condition, as the A1C to glucose chart offers a comprehensive perspective on glucose control that daily blood glucose tests cannot provide. Recent success stories, such as that of M.L., demonstrate the potential for significant health improvements through personalized care and lifestyle changes. M.L. achieved an A1C reduction from 9.1 to 5.7, highlighting the potential benefits of a tailored approach to managing blood sugar levels.
Moreover, the four lesser-known power-plays discussed in the blog—such as:
- Advanced nutritional strategies
- Stress management techniques
- Community support systems
- Personalized exercise regimens
can significantly enhance health outcomes for individuals with blood sugar issues. Additionally, the age-adjusted prevalence of diagnosed blood sugar issues has increased, underscoring the necessity of regular A1C testing, which is essential for monitoring and managing this chronic condition as indicated by the A1C to glucose chart.
According to a study analyzing trends in diagnosed and undiagnosed conditions, the age-adjusted prevalence of total cases rose from 10.3% in 2001-2004 to 13.2% in 2017-2020, emphasizing the growing number of individuals requiring effective management strategies. The economic costs of this disease in the U.S. were significant in 2017, further underscoring the importance of A1C testing in managing this condition. As noted by Cheryl D. Fryar, M.S.P.H., the age-adjusted prevalence of total and diagnosed conditions related to blood sugar increased between 1999–2000 and August 2021–August 2023.
This data underscores the ongoing relevance of A1C testing in the care and management of diabetes, not only for those diagnosed but also for individuals who may remain undiagnosed.
How to Read and Use the A1C to Glucose Conversion Chart
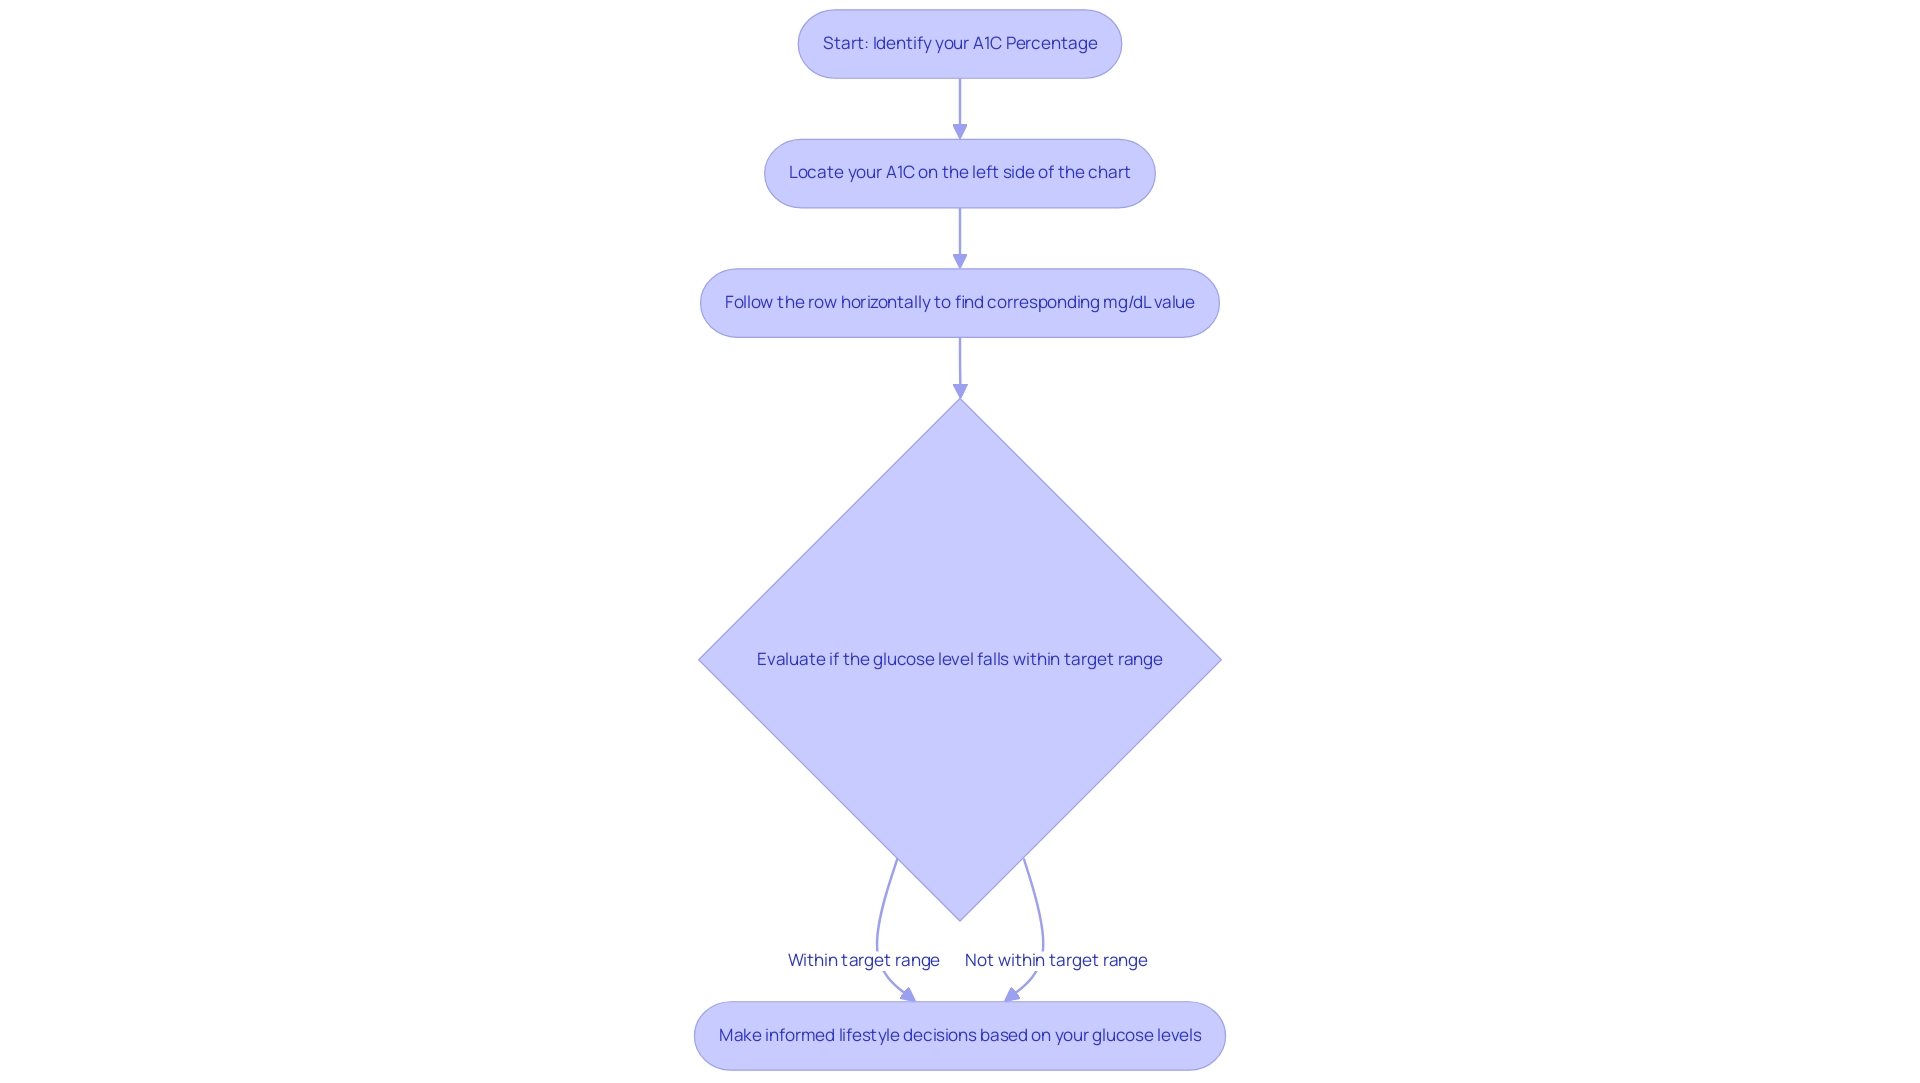
To effectively utilize the a1c to glucose chart, start by identifying your A1C percentage on the left side. From there, follow the corresponding row horizontally to determine the average blood sugar concentration in mg/dL. For example, an A1C of 6.0% corresponds to an average blood sugar concentration of roughly 126 mg/dL.
This information is crucial for evaluating whether your sugar concentrations fall within the target range set by your healthcare provider. Frequently referring to this chart not only assists in comprehending your current sugar measurements but also enables you to reduce worry about possible complications through informed lifestyle decisions, ultimately aiding you in achieving tranquility in life. As highlighted in recent studies at the Integrative Wellness Center, maintaining sugar levels within a healthy range is crucial to preventing complications like nerve damage and vision loss.
The age-adjusted prevalence of total and diagnosed cases of the condition has risen to 14.3% as of August 2023, highlighting the necessity of close glucose monitoring. Cheryl D. Fryar, M.S.P.H., notes that understanding these trends is vital for effective management of blood sugar conditions. Additionally, a case study titled ‘Understanding Abnormal Glucose Levels’ illustrates that hyperglycemia can lead to serious health issues, while hypoglycemia poses immediate health risks.
By utilizing the a1c to glucose chart, you can take proactive measures toward enhancing your health outcomes, challenging conventional treatment myths, and adopting a holistic approach to managing your condition at the Integrative Wellness Center.
The Relationship Between A1C Levels and Average Blood Glucose
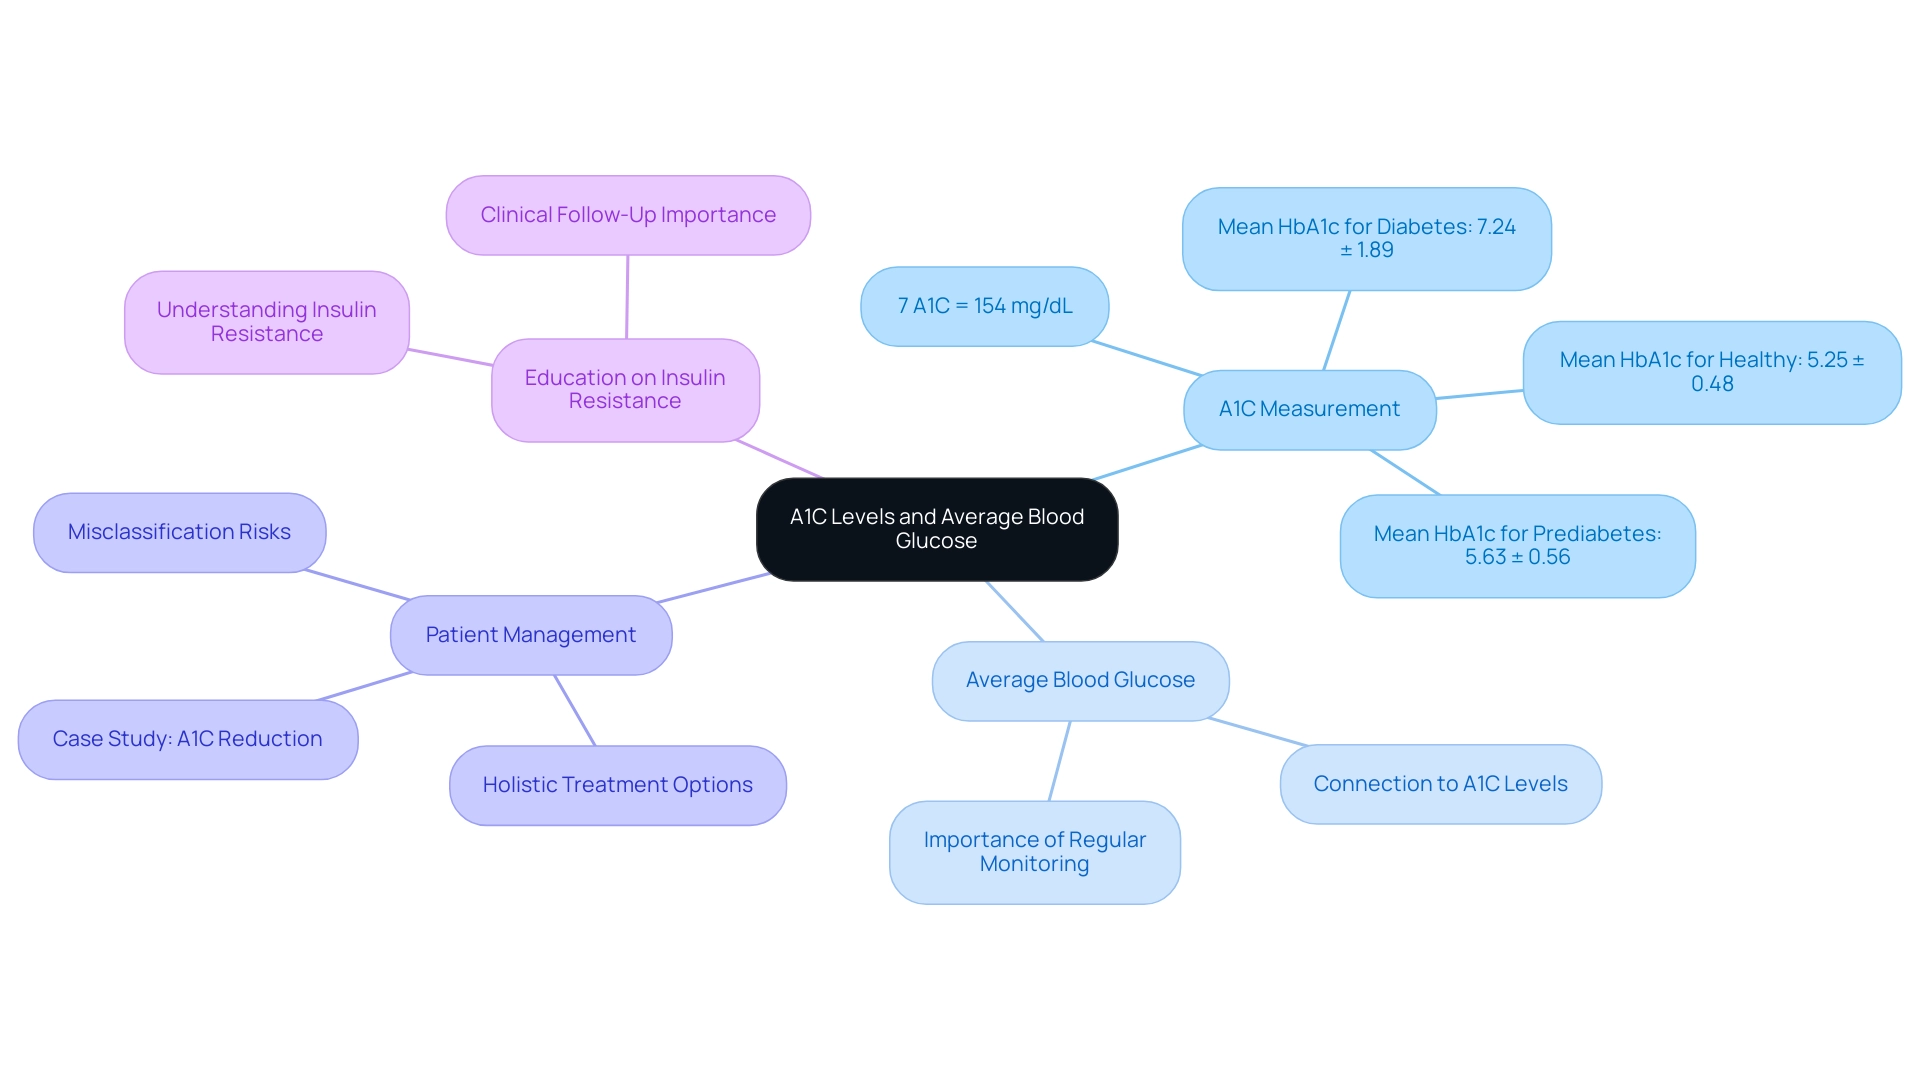
Comprehending the connection between A1C values and average blood sugar, as shown in the a1c to glucose chart, is essential for efficient diabetes management. For example, an A1C measurement of 7% can be interpreted using the a1c to glucose chart, which shows it is associated with an average blood sugar concentration of approximately 154 mg/dL. This connection highlights how consistently elevated blood glucose readings can lead to higher A1C levels, emphasizing the necessity for regular monitoring with an a1c to glucose chart.
Research indicates that the mean HbA1c for individuals with the condition is 7.24 ± 1.89, significantly above the 7% threshold, which underscores the critical need for patients to remain vigilant in their daily health practices. At the Integrative Wellness Center, we empower patients by providing comprehensive insights and treatment options aimed at reversing type 2 conditions. For example, one patient, after participating in our holistic program, successfully reduced their A1C from 8.5% to 6.8% within six months, illustrating the transformative impact of our approach.
Megan M. Kelsey from the Department of Pediatrics asserts that understanding the a1c to glucose chart is essential for effective management of the condition, allowing individuals to make informed health decisions. Additionally, misclassifying prediabetes as healthy can lead to missed clinical follow-ups, reinforcing the importance of accurate diagnosis and monitoring. Comprehending insulin resistance is also essential, as it underlies many complications related to this condition; our center offers education on this subject to assist patients in acknowledging its importance.
By keeping track of both A1C and blood sugar readings using an a1c to glucose chart, individuals can enhance their management of the condition and lessen worry about possible complications.
Practical Steps for Monitoring Your A1C Levels
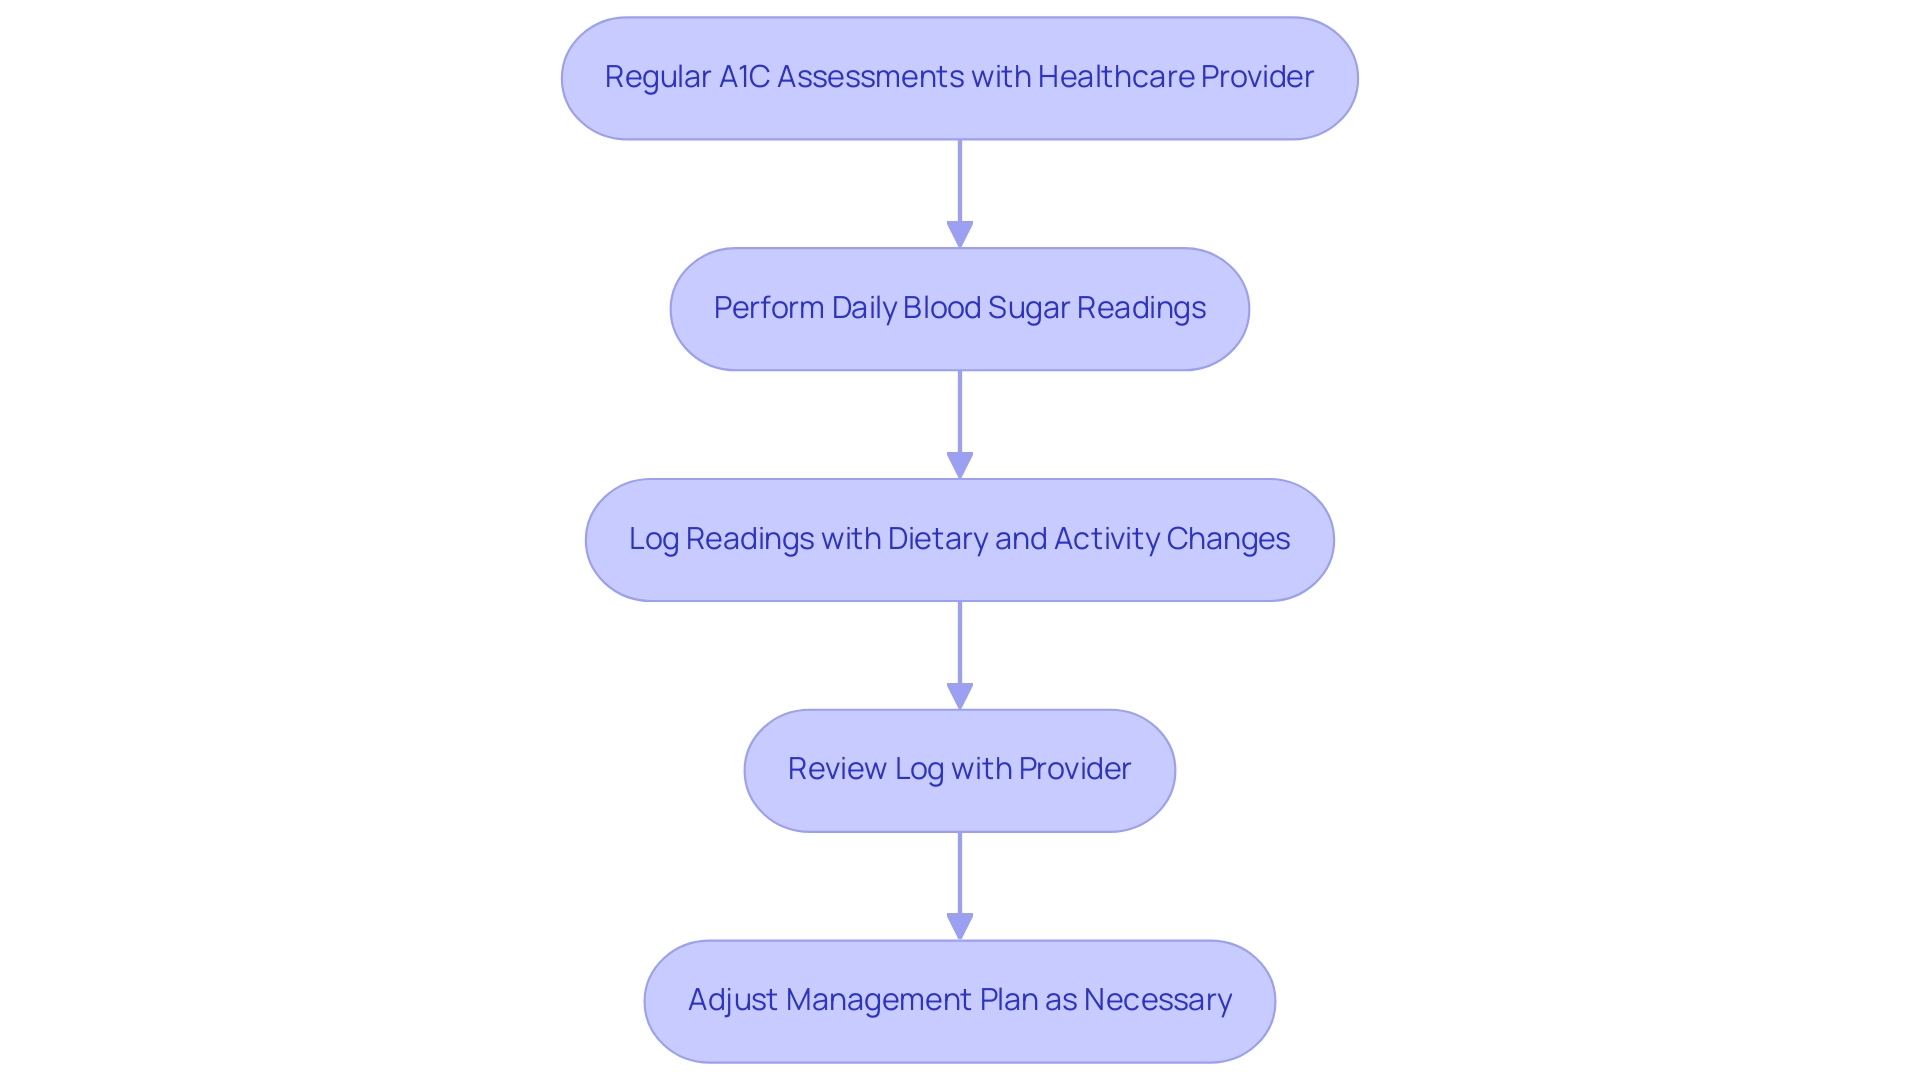
To effectively track your A1C measurements with the help of an a1c to glucose chart, it is crucial to arrange regular assessments with your healthcare provider, usually every three to six months, based on your personalized management plan. The American Diabetes Association Professional Practice Committee emphasizes the importance of consistent monitoring, stating that there remains strong consensus that establishing a uniform approach to diagnosing gestational glucose intolerance (GDM) will benefit individuals with GDM, caregivers, and policymakers. It is important to note that an A1C value of <58 mmol/mol (<7.5%) at diagnosis can suggest the presence of monogenic diabetes, providing a crucial benchmark for your health.
Along with these tests, daily self-assessment of blood sugar readings is essential for recognizing patterns and variations. A case study titled ‘Challenges in Glucose Testing’ highlights that while glucose testing is inexpensive and widely available, it also presents challenges such as high diurnal variation and potential misreporting of fasting status. Keeping a detailed log of your readings, along with any changes in diet, activity, or medication, will provide invaluable insights during healthcare appointments.
This log facilitates informed discussions about your management plan and helps to ensure that adjustments can be made as necessary. It’s also crucial to remember that while the A1C test is an important tool for understanding blood sugar measurements, it does not replace home monitoring, which is essential for tracking daily blood sugar variations as indicated by the a1c to glucose chart. Furthermore, understanding insulin resistance is crucial, as it can complicate management of the condition and may be exacerbated by traditional treatments that do not address the underlying issues.
For pregnant individuals, managing blood sugar levels is particularly important to prevent gestational complications, and strategies such as balanced nutrition and regular physical activity should be emphasized. Regular A1C testing, along with diligent self-monitoring, is fundamental to achieving optimal glycemic control, which can be effectively tracked using an a1c to glucose chart, and addressing any challenges that may arise in managing blood sugar.
Common Questions About A1C Testing and Management
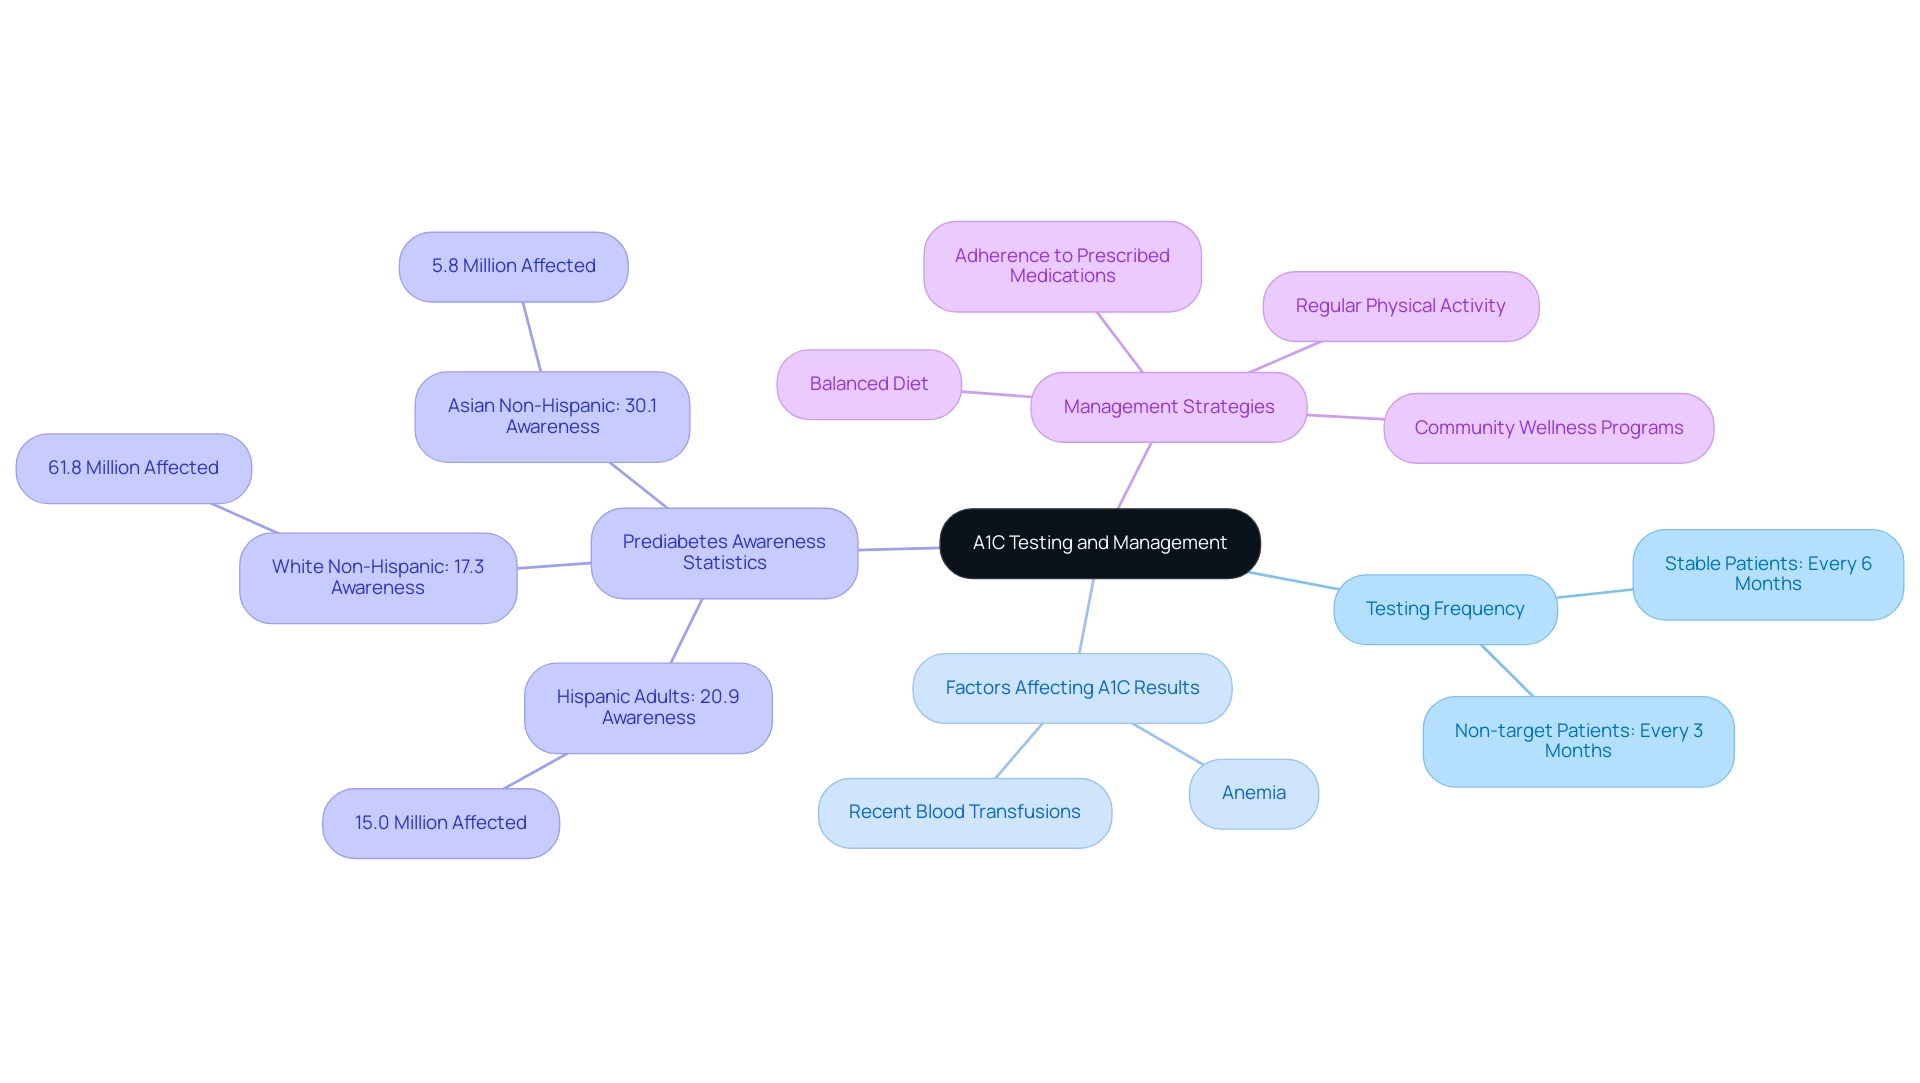
When it comes to A1C testing, several common questions arise regarding the a1c to glucose chart, including how often tests should be conducted and what factors influence the results. The American Diabetes Association recommends that individuals who are stable should undergo testing every six months, whereas those who are not meeting their targets should be tested every three months. This approach is essential for effective management of the condition, especially within a holistic framework that addresses the root causes of the illness.
Furthermore, approximately 15.0 million Hispanic adults are living with prediabetes, with an awareness rate of only 20.9%. This statistic highlights the magnitude of the issue and the necessity for education in managing this condition effectively, especially concerning insulin resistance and its implications for conventional treatments. Many patients experience anxiety surrounding the potential complications of their disease, making education and support crucial for their emotional well-being.
Additionally, various factors can affect A1C results, which can be referenced in the a1c to glucose chart, including conditions such as anemia and recent blood transfusions. These discrepancies can lead to confusion; expert Harold Lebovitz has questioned whether these variances might impede patients’ understanding of their condition, particularly in relation to the a1c to glucose chart results. To reduce A1C values, it is essential to focus on:
- Maintaining a balanced diet
- Engaging in regular physical activity
- Using the a1c to glucose chart to adhere strictly to prescribed medications
By grasping these key elements, individuals can better navigate their diabetes management journey. Community wellness programs can also play a transformative role in providing education and support tailored to the needs of diverse groups. Moreover, a case study titled ‘Prediabetes Estimates by Race-Ethnicity (2021)’ reveals that while 61.8 million white non-Hispanic individuals are affected by prediabetes, their awareness rate is only 17.3%, contrasting with Asian non-Hispanic individuals who have the highest awareness at 30.1% despite a lower prevalence of 5.8 million.
This underscores the importance of tailored educational approaches and community wellness programs to address varying levels of awareness across different racial-ethnic groups.
Conclusion
The A1C test serves as a critical tool in diabetes management, providing valuable insights into average blood glucose levels over a two to three-month period. Maintaining an A1C level below 7% is essential, as it correlates with a decreased risk of serious complications such as cardiovascular issues and neuropathy. The rise in diabetes prevalence underscores the urgency for regular A1C testing, enabling individuals to monitor their condition effectively and make informed lifestyle choices.
Understanding the relationship between A1C levels and average blood glucose is vital. By utilizing resources such as the A1C to glucose conversion chart, individuals can gain clarity on their health status and take proactive steps towards improving their outcomes. Regular monitoring, both through A1C testing and daily blood glucose checks, empowers individuals to engage actively in their diabetes management, ultimately reducing anxiety about potential complications.
Incorporating practical strategies, such as:
- Personalized dietary plans
- Stress management techniques
- Community support
can further enhance health outcomes. Education remains a cornerstone of effective diabetes management, particularly in addressing misconceptions and promoting awareness about prediabetes and insulin resistance. By prioritizing routine A1C testing and embracing a holistic approach to health, individuals can navigate their diabetes management journey with confidence, leading to improved health and quality of life.
